Large-Scale Winter Patterns
Winter Storms: Large-Scale Patterns ❄ Wintry Precipitation ❄ Notable Storms ❄ Climate Change ❄ Storm Database ❄ Latest Events
North Carolina is located in the mid-latitudes of the northern hemisphere, between the warmer tropics to our south and the colder polar region to our north. Depending on which direction our weather comes from, we can tap into each of these climates during the wintertime.
In a sense, the most favorable setup for winter storms requires having a bit of both climates converging at the same time, in just the right balance so we have enough cold air in place for frozen precipitation and enough moisture to produce a sizable snowfall.
Atmospheric Features
Here are some of the key atmospheric patterns to watch for when we’re anticipating wintry weather:
High Pressure in Place
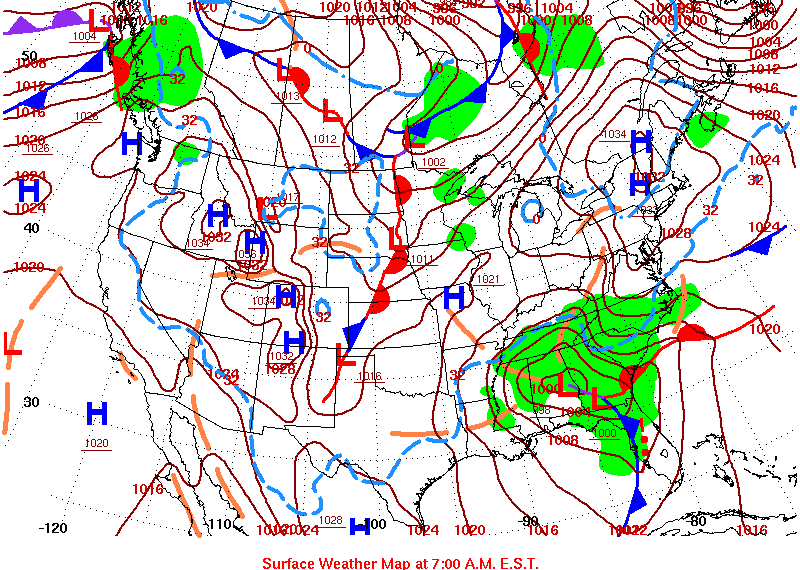
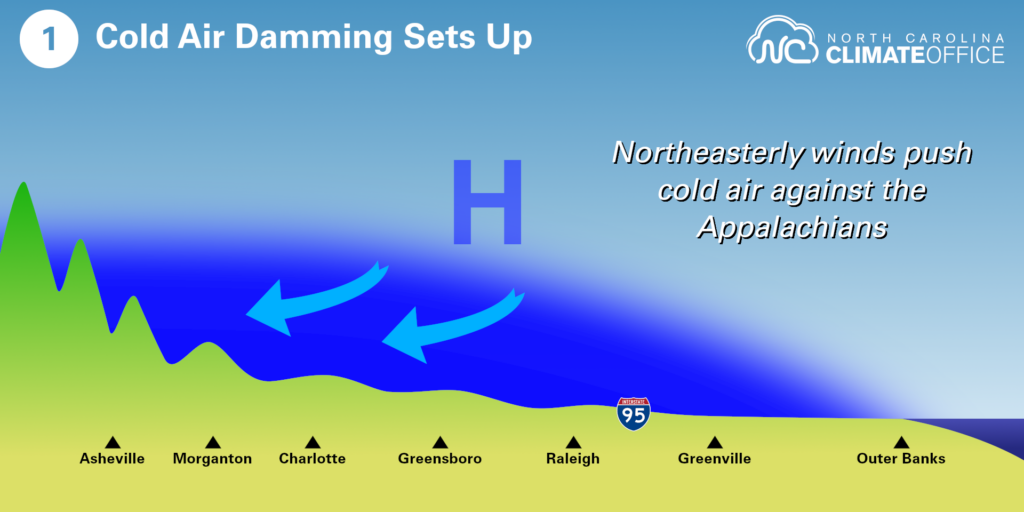
A significant snow event requires a sustained supply of cold air, and the best pattern for that is a strong high pressure system to our north. Winds circulate in a clockwise direction around high pressure in the northern hemisphere, so in this type of pattern, cold air funnels in from the north or northeast and pushes up against the Appalachian Mountains.
This is often called a “cold air damming” or “Appalachian wedge” setup because it leaves a shallow layer of cold air east of the Appalachians. Since cold air is denser than warm air, it stays in place near the surface, which helps ensure any precipitation will reach the ground in a frozen form.
These wedge patterns can be notoriously stubborn, especially if the parent high to our north is nearly stationary, since the winds around that high reinforce the cold air near the ground. In addition, because we typically see thick low-level cloud cover during these events, the cold air mass is not easily moderated by incoming solar radiation. With its ability to lock cold air in place, it’s easy to see why this is such a key pattern for wintry weather.
Low Pressure Passing By
Cold air is only half of the story, since snow also requires a source of moisture. That usually comes from a low pressure system with its origins over the Gulf of Mexico or the Gulf Stream — a warm ocean current running just off our coastline.
As these systems move over or near North Carolina, their moisture starts its journey to the ground high up in cold clouds as small ice crystals. Depending on the temperatures in the mid-levels of the atmosphere, it can fall as one of several different precipitation types, including snow, sleet, and freezing rain.
The exact track of the low pressure system will affect how much precipitation we receive and which form it falls in.
Inland Track
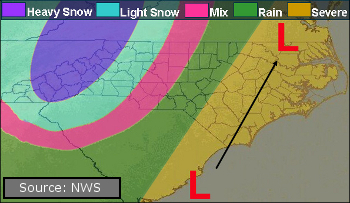
When the center of a storm system takes an inland track, passing over the Coastal Plain, snow may be limited to the far western part of the state, with a greater chance of rain and even thunderstorms farther east. With the low pressure center literally in our backyard, the pressure gradient overhead is stronger and we can see some gusty winds as a result.
Example: March 1993 storm
Near-shore Track
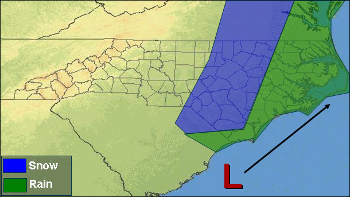
A storm taking a near-shore track, with the center of the low pressure system passing 50 to 100 miles off our coastline, allows for more sustained northerly winds across the Piedmont and a prolonged period of snow there. If temperatures are cold enough throughout the atmosphere, parts of the Coastal Plain can see snow from these events, but the immediate coastline often sees just rain.
Example: December 26, 2010 storm
Offshore Track
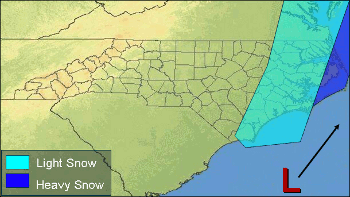
If a storm tracks farther offshore, precipitation tends to be limited to the Coastal Plain, with little to nothing across the Mountains and Piedmont due to the increased distance from the low pressure system. For significant snowfall during these events, a strong cold air mass must be in place. Otherwise, coastal areas may be too warm for sustained frozen precipitation.
Example: December 1989 storm
A Typical Event Progression
For a different view of a winter storm, we can look at a cross section across the state showing how conditions tend to take shape from west to east and from the surface throughout the lower atmosphere.
First, with high pressure in place to the north, cold air funnels in and dams up against the Appalachians. This cold layer can range from a few hundred feet deep in the east to a couple thousand feet deep in western North Carolina.
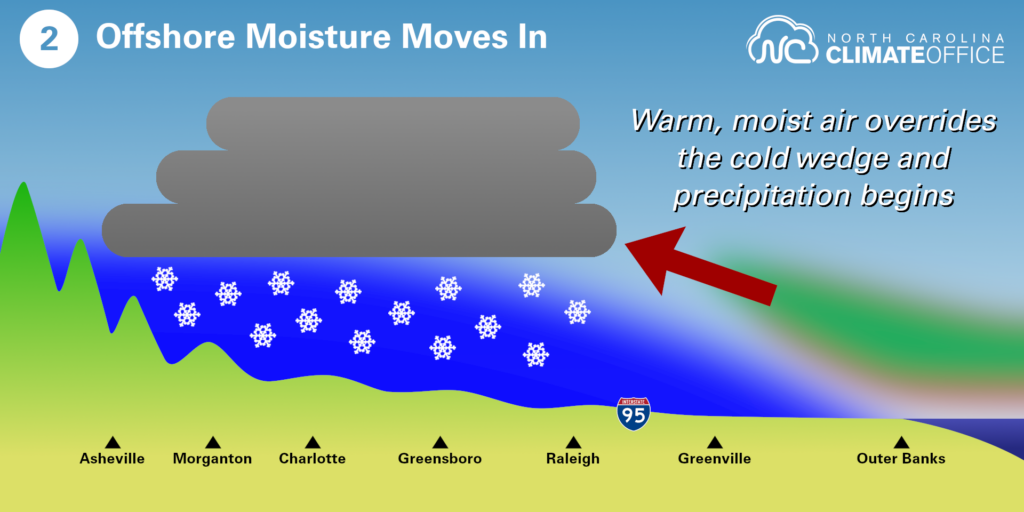
As a storm system moves in — particularly those following the inland or near-shore tracks — it pushes warm and moist air westward across the state. As that air rides over the cold dome, it forms clouds and precipitation, which often begins falling as snow.
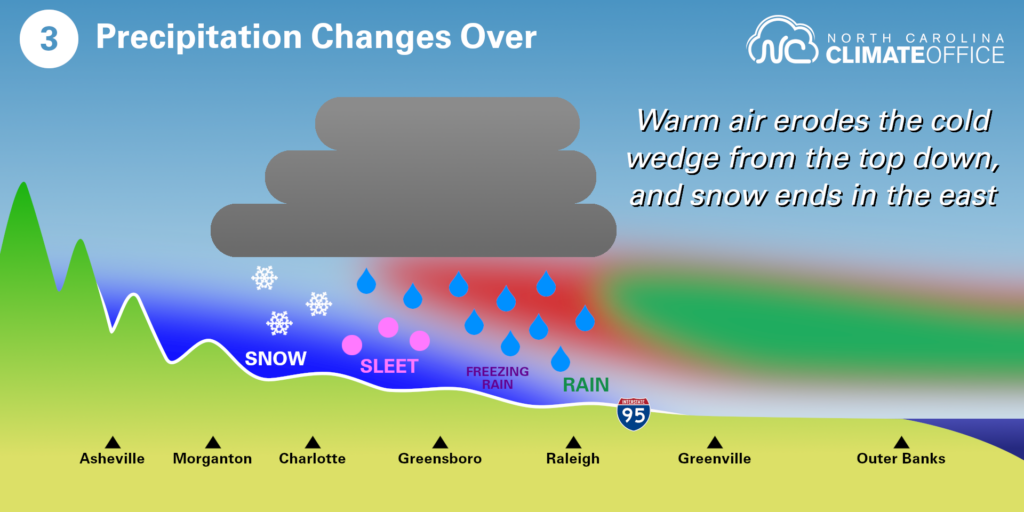
The steady supply of warm air erodes the cold dome from the top down, causing precipitation to change from snow to sleet to freezing rain and even to rain in eastern North Carolina. This effectively limits the amount of snow that most areas see during a typical wintry event.
Types of Winter Storms
Not every winter storm looks exactly the same, but many of our storm events follow one of these common setups:
A Single Coastal Low
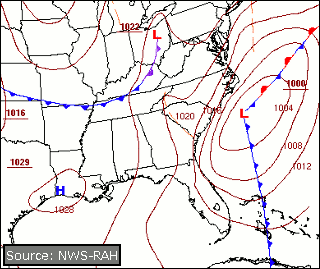
In this setup, a low pressure system forms along the Atlantic coast, strengthening over the warm waters of the Gulf Stream as it moves to the north and parallels our coastline. The counterclockwise winds around the low pressure center feed moisture inland over North Carolina, which fuels wide-reaching precipitation from the Mountains to the coast.
That precipitation tends to fall as snow in the west and transition to sleet, freezing rain, or rain farther east as the cold air wedge erodes during the event. For areas that receive all snow, these setups tend to produce some of the greatest accumulations due to the prolonged period of precipitation falling from an ample source of offshore moisture.
Because of that, this is a classic snowstorm or Nor’easter setup for North Carolina and much of the mid-Atlantic region. It is sometimes called a “simple” storm due to the single low pressure system, or a “Miller Type A” pattern as part of a classification scheme first described in 1946 by meteorologist J. E. Miller.
Example: March 1-2, 1980, snowstorm
A Pair of Lows
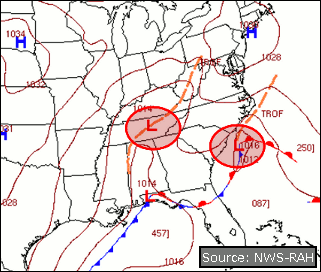
In some events, our precipitation comes from a pair of low pressure systems on either side of the state. For that reason, this is sometimes called a “complex” storm or a “Miller Type B” pattern.
Typically, a low pressure system to our west will form first, but weaken as it moves over the Appalachian Mountains. This system can bring snow across far western North Carolina. As energy from that initial low moves eastward, a second low pressure system then develops along or just off our coastline, which can bring precipitation across the eastern half of the state, similar to the Miller Type A setup.
However, cold air throughout the atmosphere is often more limited in these events, with the pair of low pressure systems punching in layers of warmer air as they pass nearby. As such, widespread snow is less common with this pattern, and a mixture of snow, sleet, and freezing rain can occur well inland.
Example: February 4-6, 2010, snow and ice storm
Northwest Flow Snow
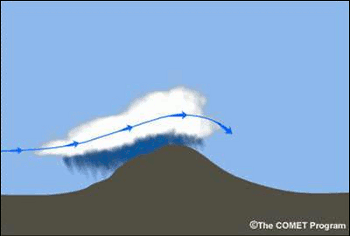
Even without a strong low pressure system nearby, it’s possible for parts of the state to see snow from other patterns as long as enough moisture is available in the atmosphere. That’s the case in the Mountains during these so-called Northwest Flow snow events.
As the name implies, these are associated with northwesterly winds – often behind a cold frontal passage – that rise up the mountain slopes and produce snow showers. Precipitation tends to be highly localized during these sorts of systems, with even valley locations like Asheville seeing little to no accumulations.
For areas that do see snow in this pattern, snow-to-liquid equivalency rates are usually very high, and little melting occurs due to the very cold air moving in from the northwest.
Example: February 8-11, 2016, snow event
Global Climate Patterns
On any given day or week of the winter, our snow chances come down to the exact setup of weather patterns in our region of the country, and even highly local factors such as surface air temperatures and topography.
However, some larger-scale patterns – including a few with a level of seasonal-scale predictability – are known to affect the availability of cold air or moisture-rich storm systems along our coastline, so we also consider them when assessing our snow chances for any given winter.
ENSO and Snow
The global pattern called the El Niño/Southern Oscillation, or ENSO, is characterized by abnormally warm (El Niño) or cool (La Niña) water surfacing along the equator in the Pacific Ocean, with a transition between those phases typically every 1 to 3 years.
Although this phenomenon happens thousands of miles away from North Carolina, it can still affect us through shifts in the jet stream, which derive their strength from the temperature difference from north to south.
During El Niño events, warmer water along the equator warms the air above it, which strengthens the jet streams. A stronger jet stream is less wavy; think of it as a thicker rope that’s tougher to twist or buckle.
In the wintertime, the subtropical jet stream tends to run from west to east over the Gulf of Mexico, and weather systems being carried along by the jet stream can pick up moisture from the Gulf and deposit it as precipitation across North Carolina.
Because of that, El Niño winters tend to be wetter than normal for us, with potentially more coastal low pressure systems. However, recent El Niño winters such as 2015-16 have also been warmer, with downright tropical air moving in as well. That has limited our snow chances in those years.
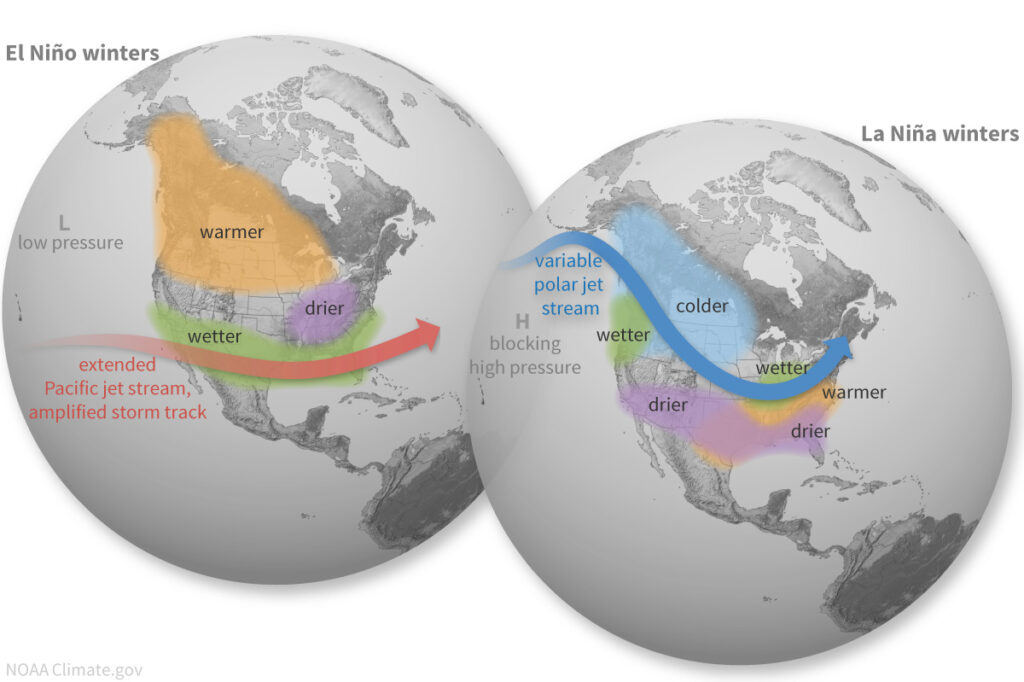
During La Niña events, the jet streams are weaker due to a reduced north-to-south temperature difference. This tends to make for a wavier jet stream configuration that also retreats farther north, so instead of a storm track through the Gulf of Mexico, weather systems tend to track through the Ohio Valley, bringing less precipitation to North Carolina.
La Niña winters therefore tend to be drier than normal for us with fewer opportunities for ideal wintry setups. However, if La Niña’s grip on the jet stream breaks and favorable patterns take shape, we can still see snow during these years, such as the four consecutive snows in both January 2000 and January 2022.
The Polar Vortex
For most snowstorms, high pressure in place to our north will suffice. But for cold air outbreaks, we need an even broader-scale pattern to step up. Enter the polar vortex.
While it sounds like something out of a science fiction movie, the polar vortex simply refers to a permanent circulation pattern in the upper atmosphere that normally surrounds the north pole. When the polar vortex — and the polar jet stream that surrounds it — is strong, cold air stays bottled up near the pole. But when the polar vortex weakens, it can split into different pieces, like a rack of pool balls being broken apart.
Occasionally, one of those detached pieces of the polar vortex will dive southward across the eastern United States, and along with it, the polar jet stream can dip unusually far south, with a blast of Arctic air headed our way. For that reason, we sometimes describe the polar vortex as being the gatekeeper to cold air.
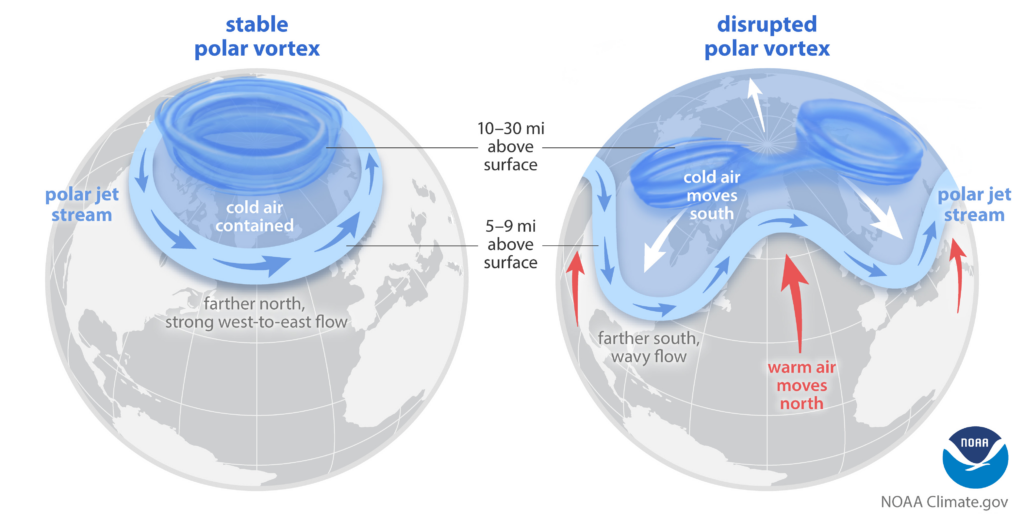
This type of setup is responsible for some of our coldest recorded temperatures, including the record lows on January 21, 1985. That’s no guarantee of snow since we also need a source of moisture. Sometimes, though, the timing is right as that cold air mass relaxes back to the north and moisture moves in from the south so we can see accumulating snow. That was the case in January 2017, where more than a week of bitter cold air was followed by a snowstorm.
One of the most common causes for a weakening polar vortex is a sudden stratospheric warming event, when temperatures many miles above the earth’s surface rapidly increase. Some research suggests these events can be triggered by surface-level tendencies, such as the buildup of snow cover over Eurasia in the fall. Those types of signals could therefore give us a basic indication of which way the polar vortex may lean — strong or weak — during the following winter.
Blocking High Pressure
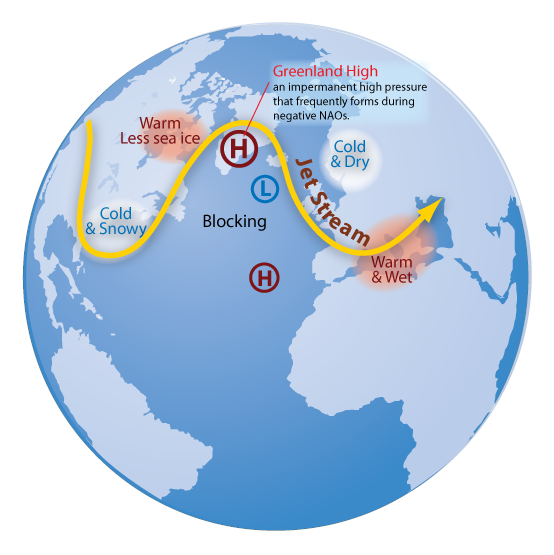
If you look at weather maps for many of our major snow events, you may notice a common characteristic. In addition to the surface-level high pressure over New England, there is often an upper-level high pressure system positioned over eastern Canada or Greenland. This is sometimes called a “blocking high” because of the impact it has on the weather upstream.
Just like a blocking football player forces any defenders to go around him, upper-level blocking highs force the jet stream to divert southward. That sort of pattern can deliver cold air from the north and orient the storm track so that it carries in moisture-rich weather systems from the south — two of the key atmospheric features for snow.
We can monitor these patterns through the phases of the Arctic Oscillation and North Atlantic Oscillation.
The Arctic Oscillation (AO) is related to the strength of the polar vortex and polar jet stream, so a negative-phase AO is associated with a weaker vortex and an increased chance of cold air diving southward.
The North Atlantic Oscillation (NAO) describes the pressure difference across the northern Atlantic Ocean, between Iceland in the west and the Azores islands in the east. A negative NAO occurs when higher pressure is in place to the west, which is characteristic of that blocking high.
Past research at our office found that the AO and NAO phases are strongly correlated with frequency of snowfall in North Carolina. This is a nice numerical way of showing what this page has emphasized: the weather patterns are key, and often nuanced, when it comes to snow in North Carolina.