Station Scout
› UNCA - UNC Asheville Weather Tower
Current Wx.
Location
Parameters
Plot Recent Data
Almanac
Thresholds
Current Conditions
 Loading data...
Sky Conditions
 Loading data...
Yesterday's Weather
 Loading data...
Year-to-Date Conditions
 Loading data...
Summary
Station ID:
UNCA
Station Name:
UNC Asheville Weather Tower
City:
Asheville, NC
Elevation:
2367 feet above sea level
Network:
ECONET
(about)
North Carolina Environment and Climate Observing Network: The NC ECONet combines sensors from several networks into a single comprehensive database. SCO stations record hourly weather and environmental conditions are recorded by automated sensors. Parameters include air temperature, humidity, winds, precipitation, pressure, solar radiation, soil temperature, and soil moisture.Sensors are maintained by the State Climate Office. Observations are available each hour (generally since 1996) and every one minute (generally since the mid 2000s).
Supported By:
UNC Asheville
Location
Latitude:
35.62233°N
Longitude:
82.56646°W
History
Data Begins:
May 7, 2019
Data Ends:
September 1, 2025
One-Minute Data:
Available
(since May 7, 2019)
Hourly Data:
Available
(since Jul 13, 2019)
Daily Data:
Available
(since Jul 13, 2019)
Network Overview
The ECONet is the NC State Climate Office's flagship network for research-grade weather observations. These stations measure all standard weather variables, along with parameters such as solar radiation, soil moisture and temperature, and leaf wetness, designed to aid with agricultural condition monitoring. ECONet data is processed each hour using rigorous quality control routines to flag potentially bad data and alert technicians of sensors that may need to be fixed or replaced.
Network Operated By:
NC State Climate Office
Data Provider:
Sensors in this Network:
More About this Station:
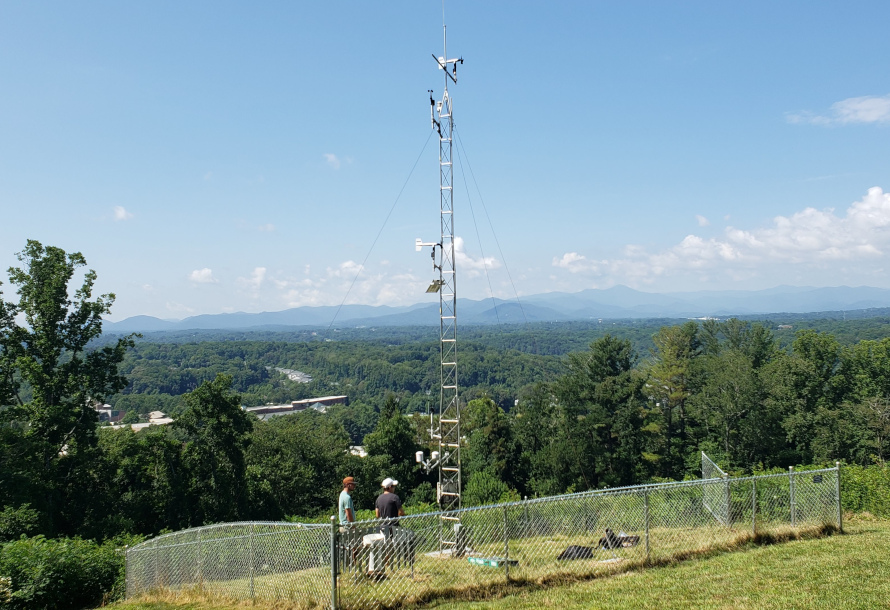
Station Photo

The UNC Asheville Weather Tower ECONet station.
Photo by the NC State Climate Office
Taken July 15, 2021
Parameters Measured
Observation Frequency:
Select an observation frequency above to view parameters measured by this station.
Parameter Timelines
Select a Time Period
Observation Frequency
Period Length
Need data over a longer or historical period? Request it from Cardinal.
Select a Parameter
Update Plot
(0 selected)
Clear Plot
Air Temperature
▼
Parameter
Level
Plot
2m
2m
2m
2m
2m
2m
2m
2m
2m
Air Pressure
▲
Parameter
Level
Plot
2m
2m
2m
Humidity
▲
Parameter
Level
Plot
2m
2m
2m
Precipitation
▲
Parameter
Level
Plot
1m
2m
Wind Speed & Direction
▲
Parameter
Level
Plot
10m
10m
10m
Wind Gust
▲
Parameter
Level
Plot
10m
Solar Radiation
▲
Parameter
Level
Plot
2m
2m
Soil Temperature
▲
Parameter
Level
Plot
10cm
10cm
10cm
Soil Moisture
▲
Parameter
Level
Plot
20cm
20cm
20cm
Apparent Temperature
▲
Parameter
Level
Plot
2m
2m
2m
2m
2m
Thermal Units
▲
Parameter
Base
Level
Plot
°F
2m
°F
2m
°F
2m
°F
2m
°F
2m
°F
2m
2m
2m
2m
2m
Evapotranspiration
▲
Parameter
Level
Plot
2m
Leaf Wetness
▲
Parameter
Level
Plot
60cm
Air Temperature
▼
Parameter
Level
Plot
2m
2m
2m
Air Pressure
▲
Parameter
Level
Plot
2m
Humidity
▲
Parameter
Level
Plot
2m
Precipitation
▲
Parameter
Level
Plot
1m
2m
Wind Speed & Direction
▲
Parameter
Level
Plot
10m
Wind Gust
▲
Parameter
Level
Plot
10m
Solar Radiation
▲
Parameter
Level
Plot
2m
2m
Soil Temperature
▲
Parameter
Level
Plot
10cm
Soil Moisture
▲
Parameter
Level
Plot
20cm
Apparent Temperature
▲
Parameter
Level
Plot
2m
2m
2m
2m
2m
Leaf Wetness
▲
Parameter
Level
Plot
60cm
Air Temperature
▼
Parameter
Level
Plot
2m
2m
2m
2m
2m
2m
2m
Air Pressure
▲
Parameter
Level
Plot
2m
Humidity
▲
Parameter
Level
Plot
2m
Precipitation
▲
Parameter
Level
Plot
1m
2m
Wind Speed & Direction
▲
Parameter
Level
Plot
10m
10m
Wind Gust
▲
Parameter
Level
Plot
10m
Solar Radiation
▲
Parameter
Level
Plot
2m
2m
Soil Temperature
▲
Parameter
Level
Plot
10cm
Soil Moisture
▲
Parameter
Level
Plot
20cm
Apparent Temperature
▲
Parameter
Level
Plot
2m
2m
2m
2m
Thermal Units
▲
Parameter
Base
Level
Plot
°F
2m
°F
2m
°F
2m
2m
2m
Evapotranspiration
▲
Parameter
Level
Plot
2m
2m
Leaf Wetness
▲
Parameter
Level
Plot
60cm
Plot of Recent Data
Select an observation frequency, period length, and up to 2 parameters in the panels above to view a plot of those recent observations.
The Almanac panel includes summaries of various parameters across multiple time periods, such as yesterday's high temperature or the total precipitation over the past 3 months, along with their historical rankings, averages, maximum, and minimum values.
To begin, select a date below and click "View Almanac". Once the Statistics by Time Period load, click the name of any Parameter to view a table of its recent observations. To view historical annual rankings, click on any colored icon under the Ranking column.
To begin, select a date below and click "View Almanac". Once the Statistics by Time Period load, click the name of any Parameter to view a table of its recent observations. To view historical annual rankings, click on any colored icon under the Ranking column.
Statistics by Time Period
Select a date above to view conditions and rankings for various time periods ending on that date
Additional Information
The Thresholds panel can display historical statistics for weather conditions reaching a given threshold, such as the average timing of first and last seasonal days below freezing or the number of days per year with temperatures at or above 90°F.
To begin, select a parameter, a threshold, and other options below, then click "View Statistics".
To begin, select a parameter, a threshold, and other options below, then click "View Statistics".
Select a Parameter
Air Temperature
▼
Humidity
▲
Precipitation
▲
Wind Speed & Direction
▲
Soil Temperature
▲
Soil Moisture
▲
Apparent Temperature
▲
Select Time Options
Historical Period
Year Type
Filter Dates
Months to Include:
Seasons to Include:
View Statistics
Statistics
Data Display