Station Scout
› KSUT - Brunswick County Airport
Current Wx.
Location
Parameters
Plot Recent Data
Almanac
Thresholds
Current Conditions
 Loading data...
Sky Conditions
 Loading data...
Yesterday's Weather
 Loading data...
Year-to-Date Conditions
 Loading data...
Summary
Station ID:
KSUT
Station Name:
Brunswick County Airport
City:
Southport, NC
Elevation:
24.9 feet above sea level
Network:
AWOS
(about)
NC DOT/FAA Automated Weather Observing System: Similar to ASOS, AWOS records hourly weather conditions, usually at airports. AWOS sensors are installed and maintained by the NC Department of Transportation Aviation Division following FAA guidelines. AWOS record most of the same measurements that ASOS record, but precipitation is not always recorded.
Supported By:
Federal Aviation Administration / Local Aviation
Location
Latitude:
33.929°N
Longitude:
78.075°W
History
Data Begins:
May 25, 2004
Data Ends:
November 2, 2025
One-Minute Data:
Not Available
Hourly Data:
Available
(since May 25, 2004)
Daily Data:
Can Be Calculated
(using hourly observations)
Network Overview
AWOS stations are typically located at smaller airports, but like their ASOS cousins, the goal of these stations is to provide the needed information for incoming and outgoing air traffic. AWOS stations report at least once per hour, and sometimes every 20 minutes. These stations are completely automated, so fields such as the visibility, present weather, and cloud cover determined by optical sensors rather than human observers, and thus may not be completely accurate especially during complex weather events.
Network Operated By:
Federal Aviation Administration
Data Provider:
Sensors in this Network:
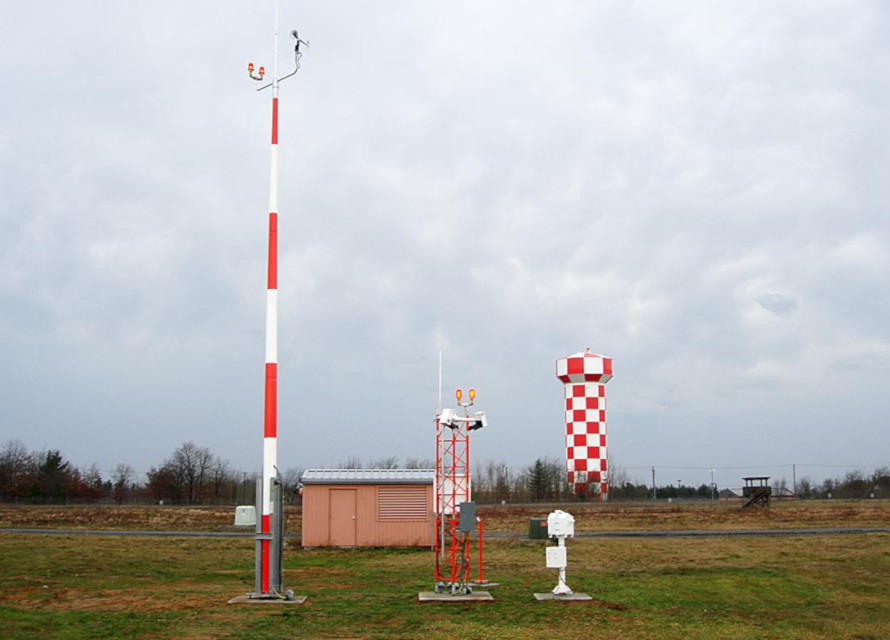
Network Photo

The AWOS station on Wheeler-Sack Army Airfield at Fort Drum, NY.
Photo from Coastal Environmental Systems
Parameters Measured
Observation Frequency:
Select an observation frequency above to view parameters measured by this station.
Parameter Timelines
Select a Time Period
Observation Frequency
Period Length
Need data over a longer or historical period? Request it from Cardinal.
Select a Parameter
Update Plot
(0 selected)
Clear Plot
Air Temperature
▼
Parameter
Level
Plot
2m
2m
2m
2m
2m
2m
Air Pressure
▲
Parameter
Level
Plot
2m
2m
2m
Humidity
▲
Parameter
Level
Plot
2m
2m
2m
Precipitation
▲
Parameter
Level
Plot
1m
Wind Speed & Direction
▲
Parameter
Level
Plot
10m
10m
10m
Wind Gust
▲
Parameter
Level
Plot
10m
Sky Conditions
▲
Parameter
Level
Plot
Apparent Temperature
▲
Parameter
Level
Plot
2m
2m
Thermal Units
▲
Parameter
Base
Level
Plot
°F
2m
°F
2m
°F
2m
°F
2m
°F
2m
°F
2m
2m
2m
2m
2m
Air Temperature
▼
Parameter
Level
Plot
2m
2m
Air Pressure
▲
Parameter
Level
Plot
2m
Humidity
▲
Parameter
Level
Plot
2m
Precipitation
▲
Parameter
Level
Plot
1m
Wind Speed & Direction
▲
Parameter
Level
Plot
10m
Wind Gust
▲
Parameter
Level
Plot
10m
Sky Conditions
▲
Parameter
Level
Plot
Apparent Temperature
▲
Parameter
Level
Plot
2m
2m
Air Temperature
▼
Parameter
Level
Plot
2m
2m
2m
2m
2m
2m
Air Pressure
▲
Parameter
Level
Plot
2m
Humidity
▲
Parameter
Level
Plot
2m
Precipitation
▲
Parameter
Level
Plot
1m
Wind Speed & Direction
▲
Parameter
Level
Plot
10m
10m
Wind Gust
▲
Parameter
Level
Plot
10m
Sky Conditions
▲
Parameter
Level
Plot
Apparent Temperature
▲
Parameter
Level
Plot
2m
2m
Thermal Units
▲
Parameter
Base
Level
Plot
°F
2m
°F
2m
°F
2m
2m
2m
Plot of Recent Data
Select an observation frequency, period length, and up to 2 parameters in the panels above to view a plot of those recent observations.
The Almanac panel includes summaries of various parameters across multiple time periods, such as yesterday's high temperature or the total precipitation over the past 3 months, along with their historical rankings, averages, maximum, and minimum values.
To begin, select a date below and click "View Almanac". Once the Statistics by Time Period load, click the name of any Parameter to view a table of its recent observations. To view historical annual rankings, click on any colored icon under the Ranking column.
To begin, select a date below and click "View Almanac". Once the Statistics by Time Period load, click the name of any Parameter to view a table of its recent observations. To view historical annual rankings, click on any colored icon under the Ranking column.
Statistics by Time Period
Select a date above to view conditions and rankings for various time periods ending on that date
Additional Information
The Thresholds panel can display historical statistics for weather conditions reaching a given threshold, such as the average timing of first and last seasonal days below freezing or the number of days per year with temperatures at or above 90°F.
To begin, select a parameter, a threshold, and other options below, then click "View Statistics".
To begin, select a parameter, a threshold, and other options below, then click "View Statistics".
Select a Parameter
Air Temperature
▼
Humidity
▲
Precipitation
▲
Wind Speed & Direction
▲
Apparent Temperature
▲
Select Time Options
Historical Period
Year Type
Filter Dates
Months to Include:
Seasons to Include:
View Statistics
Statistics
Data Display