Station Scout
› BSKN7 - Busick
Current Wx.
Location
Parameters
Plot Recent Data
Almanac
Thresholds
Current Conditions
 Loading data...
Sky Conditions
 Loading data...
Yesterday's Weather
 Loading data...
Year-to-Date Conditions
 Loading data...
Summary
Station ID:
BSKN7
Station Name:
Busick
City:
Busick, NC
Elevation:
3041 feet above sea level
Network:
RAWS
(about)
Remoted Automated Weather Stations (RAWS) provide weather data that assists land management agencies with a variety of projects, such as monitoring air quality and rating fire danger. Parameters include standard weather measurements of temperature, dew point, pressure, winds, relative humidity, and precipitation, as well as solar radiation, fuel temperature, and fuel moisture.
Supported By:
MesoWest
Location
Latitude:
35.744786°N
Longitude:
82.215003°W
History
Data Begins:
February 20, 2003
Data Ends:
February 14, 2026
One-Minute Data:
Not Available
Hourly Data:
Available
(since Feb 20, 2003)
Daily Data:
Can Be Calculated
(using hourly observations)
Network Overview
RAWS stations are intended primarily for condition monitoring, including fire weather, in often forested or remote landscapes. These automated report hourly observations with most standard weather variables, although wind speed is measured at a height of 6 meters or 20 feet, rather than the 10-meter standard. Certain portable RAWS stations may be temporarily deployed to points of interested. These smaller tripod-style stations measure winds at a height of only 2 meters.
Network Operated By:
U.S. Forest Service
Data Provider:
Sensors in this Network:
More About this Station:
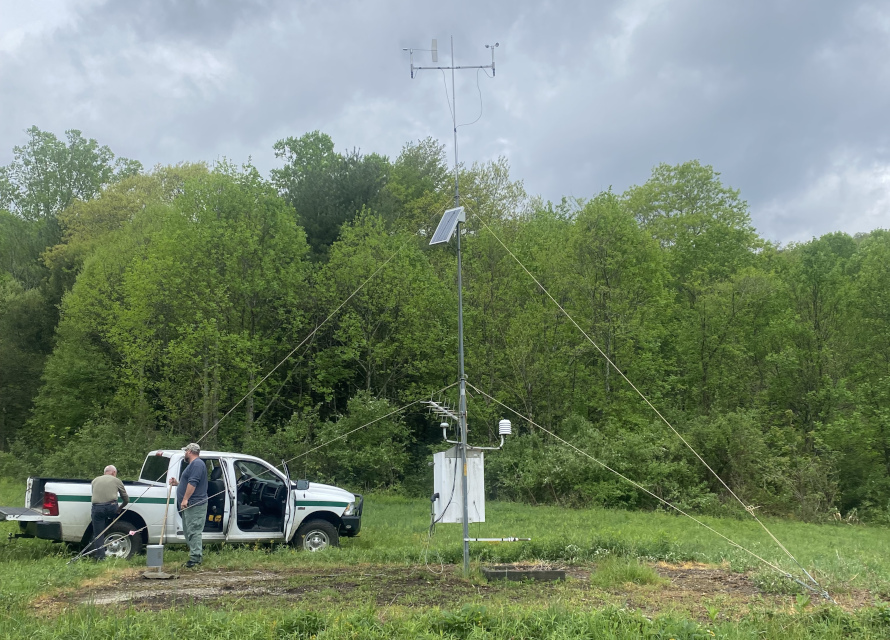
Station Photo

The Busick RAWS station.
Photo from the Western Regional Climate Center
Taken in May 2022
Parameters Measured
Observation Frequency:
Select an observation frequency above to view parameters measured by this station.
Parameter Timelines
Select a Time Period
Observation Frequency
Period Length
Need data over a longer or historical period? Request it from Cardinal.
Select a Parameter
Update Plot
(0 selected)
Clear Plot
Air Temperature
▼
Parameter
Level
Plot
2m
2m
2m
2m
2m
2m
Air Pressure
▲
Parameter
Level
Plot
2m
2m
2m
Humidity
▲
Parameter
Level
Plot
2m
2m
2m
Precipitation
▲
Parameter
Level
Plot
1m
Solar Radiation
▲
Parameter
Level
Plot
2m
Apparent Temperature
▲
Parameter
Level
Plot
2m
2m
Thermal Units
▲
Parameter
Base
Level
Plot
2m
2m
2m
2m
Air Temperature
▼
Parameter
Level
Plot
2m
2m
Air Pressure
▲
Parameter
Level
Plot
2m
Humidity
▲
Parameter
Level
Plot
2m
Precipitation
▲
Parameter
Level
Plot
1m
Apparent Temperature
▲
Parameter
Level
Plot
2m
2m
Air Temperature
▼
Parameter
Level
Plot
2m
2m
2m
2m
2m
2m
Air Pressure
▲
Parameter
Level
Plot
2m
Humidity
▲
Parameter
Level
Plot
2m
Precipitation
▲
Parameter
Level
Plot
1m
Solar Radiation
▲
Parameter
Level
Plot
2m
Apparent Temperature
▲
Parameter
Level
Plot
2m
2m
Thermal Units
▲
Parameter
Base
Level
Plot
2m
2m
Plot of Recent Data
Select an observation frequency, period length, and up to 2 parameters in the panels above to view a plot of those recent observations.
The Almanac panel includes summaries of various parameters across multiple time periods, such as yesterday's high temperature or the total precipitation over the past 3 months, along with their historical rankings, averages, maximum, and minimum values.
To begin, select a date below and click "View Almanac". Once the Statistics by Time Period load, click the name of any Parameter to view a table of its recent observations. To view historical annual rankings, click on any colored icon under the Ranking column.
To begin, select a date below and click "View Almanac". Once the Statistics by Time Period load, click the name of any Parameter to view a table of its recent observations. To view historical annual rankings, click on any colored icon under the Ranking column.
Statistics by Time Period
Select a date above to view conditions and rankings for various time periods ending on that date
Additional Information
The Thresholds panel can display historical statistics for weather conditions reaching a given threshold, such as the average timing of first and last seasonal days below freezing or the number of days per year with temperatures at or above 90°F.
To begin, select a parameter, a threshold, and other options below, then click "View Statistics".
To begin, select a parameter, a threshold, and other options below, then click "View Statistics".
Select a Parameter
Air Temperature
▼
Humidity
▲
Precipitation
▲
Wind Speed & Direction
▲
Apparent Temperature
▲
Select Time Options
Historical Period
Year Type
Filter Dates
Months to Include:
Seasons to Include:
View Statistics
Statistics
Data Display