Station Scout
› 313017 - Fayetteville Pwc
Current Wx.
Location
Parameters
Plot Recent Data
Almanac
Thresholds
Current Conditions
 Loading data...
Sky Conditions
 Loading data...
Yesterday's Weather
 Loading data...
Year-to-Date Conditions
 Loading data...
Summary
Station ID:
313017
Station Name:
Fayetteville Pwc
City:
Fayetteville, NC
Elevation:
96 feet above sea level
Network:
COOP
(about)
NWS Cooperative Observer: Daily air temperatures and precipitation are recorded by volunteers. Sensors are maintained by National Weather Service. Coop data make up the bulk of the historical climate record - several stations in NC have records for over 100 years. Current observations are available for many stations on the next day. Some stations only have updated observations 3-6 months later. There is a Coop station in almost every county in North Carolina.
Supported By:
NOAA National Weather Service
Location
Latitude:
35.05833°N
Longitude:
78.85833°W
History
Data Begins:
November 1, 1871
Data Ends:
October 31, 2025
One-Minute Data:
Not Available
Hourly Data:
Not Available
Daily Data:
Available
(since Nov 1, 1871)
Network Overview
COOP stations have minimal instrumentation but often have long periods of record for two key weather parameters: daily temperatures and precipitation. Observations are made once per day, and may be recorded automatically or manually by a volunteer observer. Hand-coded observations may take several months to become available online, while computer-submitted ones should show up by the next day.
Network Operated By:
National Centers for Environmental Information (NCEI)
Data Provider:
Sensors in this Network:
More About this Station:
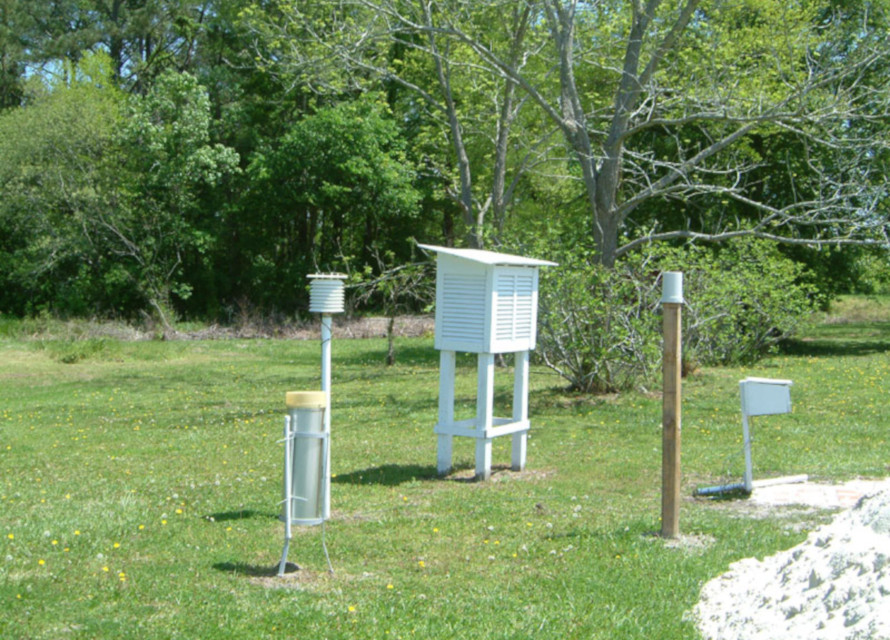
Network Photo

A COOP station near Cleveland, OH.
Photo from NWS Cleveland
Parameters Measured
Observation Frequency:
Select an observation frequency above to view parameters measured by this station.
Parameter Timelines
Select a Time Period
Observation Frequency
Period Length
Need data over a longer or historical period? Request it from Cardinal.
Select a Parameter
Update Plot
(0 selected)
Clear Plot
Air Temperature
▼
Parameter
Level
Plot
2m
2m
2m
Precipitation
▲
Parameter
Level
Plot
1m
Thermal Units
▲
Parameter
Base
Level
Plot
°F
2m
°F
2m
°F
2m
°F
2m
°F
2m
°F
2m
Air Temperature
▼
Parameter
Level
Plot
2m
2m
2m
2m
2m
Precipitation
▲
Parameter
Level
Plot
1m
Thermal Units
▲
Parameter
Base
Level
Plot
°F
2m
°F
2m
°F
2m
Plot of Recent Data
Select an observation frequency, period length, and up to 2 parameters in the panels above to view a plot of those recent observations.
The Almanac panel includes summaries of various parameters across multiple time periods, such as yesterday's high temperature or the total precipitation over the past 3 months, along with their historical rankings, averages, maximum, and minimum values.
To begin, select a date below and click "View Almanac". Once the Statistics by Time Period load, click the name of any Parameter to view a table of its recent observations. To view historical annual rankings, click on any colored icon under the Ranking column.
To begin, select a date below and click "View Almanac". Once the Statistics by Time Period load, click the name of any Parameter to view a table of its recent observations. To view historical annual rankings, click on any colored icon under the Ranking column.
Statistics by Time Period
Select a date above to view conditions and rankings for various time periods ending on that date
Additional Information
The Thresholds panel can display historical statistics for weather conditions reaching a given threshold, such as the average timing of first and last seasonal days below freezing or the number of days per year with temperatures at or above 90°F.
To begin, select a parameter, a threshold, and other options below, then click "View Statistics".
To begin, select a parameter, a threshold, and other options below, then click "View Statistics".
Select a Parameter
Air Temperature
▼
Precipitation
▲
Select Time Options
Historical Period
Year Type
Filter Dates
Months to Include:
Seasons to Include:
View Statistics
Statistics
Data Display