About the Climate Dashboard for Corn Growers
The Climate Dashboard was sponsored by the Corn Growers Association of North Carolina and is designed to provide corn growers in North Carolina with climate-based information about seasonal corn development. The tool utilizes multiple climate and weather datasets to calculate daily heat units (growing degree days) and then aggregates these over the season to predict when different developmental stages will occur. Click on each heading below to view a tutorial, learn more about developmental stage predictions, data sets, and analyses conducted while developing the tool.
Inputs
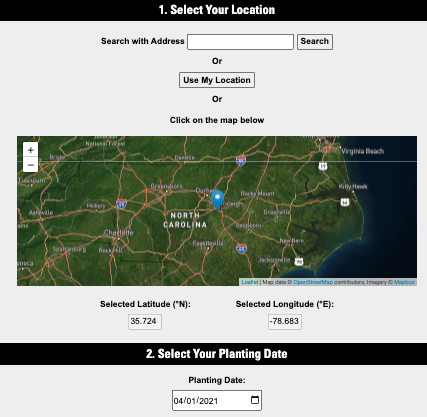
Two pieces of information are required to use the tool: a field location and a planting date. The field location is used to precisely locate the data to provide the best forecast possible; the planting date is used as a start date to begin heat unit accumulations for predicting corn development.
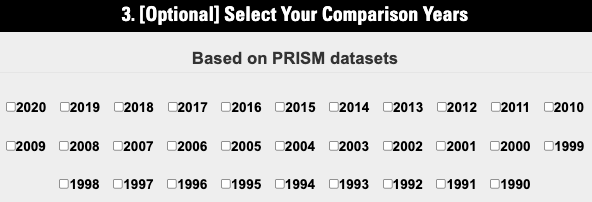
Additional (optional) selections are comparison years to include in the plot. For example, if users would like to compare the current season to last year, or to 2012, or to a different year, clicking these years here will plot additional lines on the chart enabling comparisons.
After entering a location and planting date, clicking “Update Chart” will update the page output based on user selections. By default, the page automatically loads with predictions for Raleigh and with a planting date of April 1. Users can bookmark the page with their selections so that future visits will automatically load with their customized information (scroll down to the bottom of the page to see the bookmarkable link).


Outputs
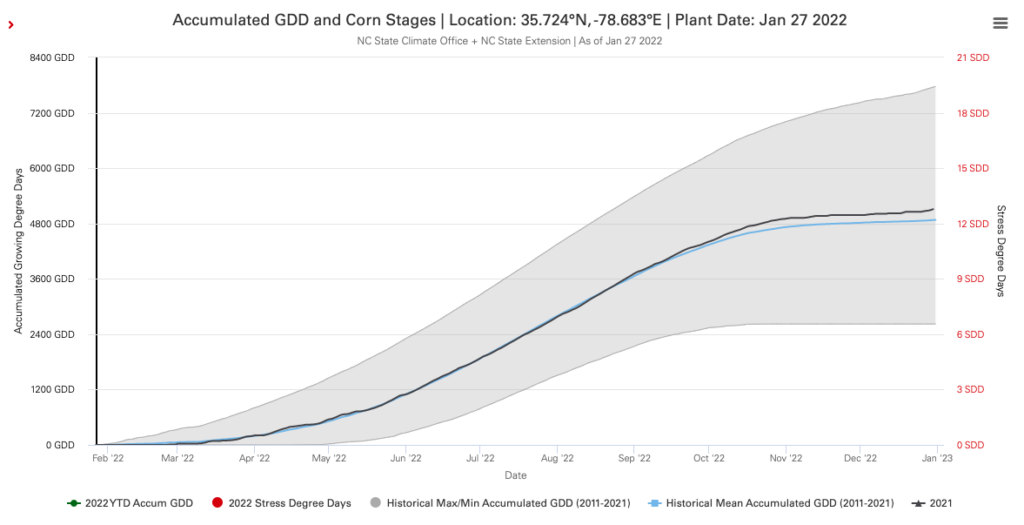
The key output is a chart showing predictions for corn development based on heat units (growing degree days) for the current season. By default, the chart is zoomed into the most recent two week period centered on today’s date, and you can zoom out by clicking on the “Zoom Out to Full Year” button in the top right corner of the chart (example chart below is zoomed out to the full season).

Stress degree days — accumulated temperatures over corn’s upper developmental threshold of 86 F — are also shown on the graph. Research conducted as part of this project revealed that growing seasons with greater numbers of stress degree days are associated with lower end-of-season yields. We provide this output to give an indication of when corn might be experiencing stress to inform users who may make management decisions to reduce stress. Daily stress degree days are shown as shaded red lines, and plotted on the secondary y-axis to the right of the graph.
Subsequent charts provide forecast information for the next 1-7 days and the next 7-days to 6 months. Short-term forecast information comes from the National Weather Service, and the daily forecasted growing degree days and stress degree days are also shown for each day. Longer-term climate outlook information comes from the National Weather Service Climate Prediction Center.
Growing degree day thresholds for predicting corn development are listed in the table below
| Stage | Description | GDD Threshold |
|---|---|---|
| V0 | Planted | |
| V2 | Two Leaves Fully Emerged | 200 |
| V4 | Four Leaves Fully Emerged | 345 |
| V6 | Six Leaves Fully Emerged | 475 |
| V8 | Eight Leaves Fully Emerged | 610 |
| V10 | Tenth Leaf Fully Emerged | 740 |
| V12 | Twelfth Leaf Fully Emerged | 870 |
| V14 | Fourteenth Leaf Fully Emerged | 1,000 |
| V16 | Sixteenth Leaf Fully Emerged | 1,135 |
| VT to R1 | Silks Emerging | 1,400 |
| R2 | Blister Stage | 1,660 |
| R4 | Dough Stage | 1,925 |
| R5 | Dent Stage | 2,190 |
| R6 | Black Layer | 2,450 |
This tool combines data from four different sources to provide seasonal growth estimates and weather- and climate-based guidance. These datasets are described below.
- PRISM stands for Parameter-Elevation Regressions on Independent Slopes Model . This is a gridded dataset that is generated for the entire contiguous US using daily surface weather station observations, radar and satellite estimates, and models of the land surface to estimate a range of weather parameters (such as temperature and precipitation). Daily PRISM grids are available for historical periods (archive dates back to 1981) and is regularly updated with the latest observations. Because of the time it takes to compile the latest data and create grids, the most recent PRISM grids are typically 2-3 days before the current date. To fill in between that lag and the present date, we use RTMA. We additionally use an average of the most recent 10-years of PRISM data to estimate development to the end of the growing season.
- The Real Time Mesoscale Analysis (RTMA) is a gridded dataset that is updated based on the latest surface weather station observations. RTMA is available hourly and this tool aggregates hourly data to daily intervals to obtain the daily maximum and minimum temperatures. RTMA is used to fill in the gap between PRISM (which typically has a 2-3 day delay) and forecast data.
- The National Digital Forecast Database (NDFD) is a suite of forecast products from the National Weather Service. This tool uses NDFD to obtain the weather forecast for the next 1-7 days, and forecasted temperatures are used to calculate daily growing degree days over this period. The 7-day forecast is also displayed in tabular format beneath the seasonal prediction graph.
- NOAA’s Climate Prediction Center (CPC) provides climatological outlooks for a range of periods. In this tool, we are providing their outlooks for the periods which have the most skill: the next 6-10 days; the next 8-14 days; 1 month; and 3 months. These information are provided in tabular output to users near the bottom of the page output to give guidance on the types of conditions that are likely to be experienced over the upcoming season.
Optimal corn development occurs within a range of air temperatures. When temperatures exceed 86°F, corn begins to experience water stress (Swan et al., 1987; Taylor, 2012). A mathematical formula describing the accumulated stress above 86°F, known as Stress Degree Days (SDD), is defined as: SDD = max(Tmax,Tupp) – Tupp.
Where Tupp is the upper developmental threshold (86°F) and Tmax is the daily maximum temperature. Using daily meteorological data and annual corn yields, we tested the hypothesis that SDDs accumulated during the growing season can predict annual yield.
Data
Annual Corn Yield
County-level grain corn yield (Bu/Acre) data were obtained from the US Department of Agriculture National Agricultural Statistics Service (USDA-NASS) for the full available period of record to the end of 2020. Figure 1 shows the annual yield over time, averaged over all counties in the state. Yield data were truncated to 1991-2020 to match the period for PRISM meteorological data (Figure 2, blue line). A trend-line was computed through the yield time series (Figure 2, orange line) and this line was subtracted from yield to remove the influence of factors other than interannual climate variability (e.g., advances in technology; Figure 3). The resulting variable is referred to as the annual corn yield anomaly.


Daily Maximum Temperature
We obtained daily gridded maximum temperature data from the PRISM Climate Group (https://prism.oregonstate.edu/). PRISM (Parameter Regression on Independent Slopes Model) is a high-quality daily temperature dataset that uses surface weather station observations combined with a digital elevation model to estimate temperatures on a 4-km grid for the conterminous US (Daly et al., 2008). We subset data to a bounding box containing the state of North Carolina. From this, daily SDDs were computed and accumulated for each year. All temperature calculations used degrees Fahrenheit.
The annual average number of SDDs follows temperature patterns in the region, with the highest SDD accumulations occurring in the southern Piedmont and Sandhills regions and the fewest in the Mountains and along the immediate Coast (the former which is cooler due to elevation and the latter due to the moderating influence of the Atlantic Ocean, Figure 4).

Results
Analysis 1: Annual SDD and Annual Corn Yield Anomaly
Annual SDDs were first aggregated to the state level by averaging across all counties, and then compared to annual yield anomaly, similarly aggregated across all NC counties (Figure 5). Yield anomaly and annual SDD accumulations are strongly and inversely correlated (r = -0.75, p < 0.001). County-level correlations also reveal statistically significant correlations between annual SDD and yield anomaly for most counties with sufficient data (Figure 6). These results suggest that annual SDD is a strong predictor for end-of-season yield.


Analysis 2: Growth Stage SDD and Annual Corn Yield Anomaly
Using April 1 as a planting date, growing degree days (using base temperature 50°F, upper threshold 86°F) were accumulated throughout each growing season and used to estimate the date of occurrence for each growth stage. Next, the corresponding SDDs for each stage were calculated (for example, all the SDDs that occurred between planting and V2 are assigned to V2). This was repeated for each year, growth stage, and county.
First, growth stage SDDs were averaged over all counties and compared to the statewide average yield. The results suggest that SDDs accumulated during V14 to R6 are strongly and statistically significantly correlated with end-of-season yield (Table 1). Figure 7 contains a graph showing the relationship between SDD accumulated during R2 and yield anomaly.

| Growth Stage | Correlation |
|---|---|
| V2 | -0.11 |
| V4 | -0.11 |
| V6 | 0.04 |
| V8 | -0.09 |
| V10 | -0.12 |
| V12 | -0.12 |
| V14 | -0.48 |
| V16 | -0.61 |
| VT-R1 | -0.55 |
| R2 | -0.61 |
| R4 | -0.66 |
| R5 | -0.48 |
| R6 | -0.52 |
Future Stress Degree Days
We also explored how stress degree days may be changing in the future as a result of climate change. According to the North Carolina Climate Science Report, temperatures have increased by approximately 1 degree Fahrenheit in North Carolina over the past century (Kunkel et al., 2020). Future warming is also projected for the state, with the exact amount of warming depending on future global emissions scenarios (high future emissions would lead to more warming). If these projections hold true, the science suggests we can experience more very hot days – the types of days that would stress corn – which could mean worse future corn yields.

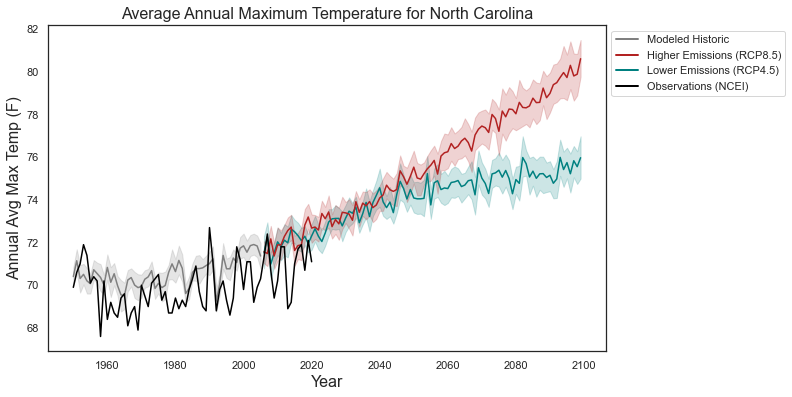
We compared downscaled output from 20 global climate models from the MACA Livneh dataset (Abatzoglou & Brown, 2012) to assess changes between historical and future projections of the number of stress degree days experienced in the state. We first assessed how reliably climate projections were able to model temperatures in North Carolina, and results suggested that these projections reasonably capture historic observed maximum temperatures in the state (see figure to the right).
We next computed annual stress degree days for each of the 20 climate projections, and compared future projections to historic baselines. Relative to a 1986-2005 baseline, SDDs are projected to increase by approximately 100 over 2020-2039 under both emissions scenarios, and by the middle of the century (2040-2059) to increase by approximately 160 under a lower emissions scenario by 220 under a higher emissions scenario (all estimates are in Fahrenheit and are based on model averages rounded to the nearest ten). Consistent with temperature projections (Kunkel et al., 2020), by the latter half of the century future annual SDD accumulations are projected to be greater under a higher emissions scenario relative to a lower emissions scenario. Relative to the 1986-2005 baseline, for the period 2060-2079 SDDs are projected to increase by approximately 200 under a lower emissions scenario and by 360 under a higher emissions scenario; for the period 2080-2099, SDDs are projected to increase by approximately 230 under a lower emissions scenario and by 530 under a higher emissions scenario. While these model averages provide an estimate for the relative magnitude of future increases in annual stress degree days, the exact amount of future stress degree day accumulations may differ based on future global greenhouse gas emissions. For this reason, we recommend focusing on relative differences rather than absolute changes. Regardless, these results reveal that future decades are likely to experience more stress degree day accumulations which may negatively impact corn yield, with the severity of warming and consequences for yield dependent upon future human actions.
References
Abatzoglou J.T. and Brown T.J. (2012) A comparison of statistical downscaling methods suited for wildfire applications, International Journal of Climatology, 32, 772-780
Daly, C., Halbleib, M., Smith, J.I., Gibson, W.P., Doggett, M.K., Taylor, G.H., Curtis, J., and Pasteris, P.A. 2008. Physiographically-sensitive mapping of temperature and precipitation across the conterminous United States. International Journal of Climatology, 28, 2031-2064.
Kunkel, K.E., D.R. Easterling, A. Ballinger, S. Bililign, S.M. Champion, D.R. Corbett, K.D. Dello, J. Dissen,
G.M. Lackmann, R.A. Luettich, Jr., L.B. Perry, W.A. Robinson, L.E. Stevens, B.C. Stewart, and A.J. Terando, 2020: North
Carolina Climate Science Report. North Carolina Institute for Climate Studies, 233 pp. https://ncics.org/nccsr
Swan, J. B., Schneider, E. C., Moncrief, J. F., Paulson, W. H., & Peterson, A. E. (1987). Estimating Corn Growth, Yield, and Grain Moisture from Air Growing Degree Days and Residue Cover 1 . Agronomy Journal, 79(1), 53–60. https://doi.org/10.2134/agronj1987.00021962007900010012x
Taylor, S. E. (2012). Water Stress in Corn: Estimating from Stress Degree Days ( SDD ). Integrated Crop Management News, Iowa State University.