PINEMAP DSS
This tool is no longer available. See the information below for more details.
For nearly a decade, the PINEMAP Decision Support System provided future projections surrounding southern loblolly pine trees, including climate-based risks and opportunities for planting. Because funding for the PINEMAP project has expired and the server on which the tool’s data was stored was shutdown, the PINEMAP DSS was officially shuttered in October 2024.
Several other tools, listed below, offer the same or similar data as was available in the PINEMAP DSS.
- CAnVAS was developed by the NC State Climate Office to inform species status assessments produced by the US Fish & Wildlife Service. It uses the same MACA dataset as the PINEMAP DSS and covers the same variables, including projections of extreme minimum temperatures and seasonal average temperatures and precipitation.
- The WaSSI Ecosystem Services Model is accessible from the US Forest Service. It includes many of the same water supply stress and ecosystem productivity variables that were featured in the PINEMAP DSS.
- The Climate Toolbox created by the University of California-Merced includes a suite of tools displaying future climate projections, with similar visualizations as the PINEMAP DSS, including:
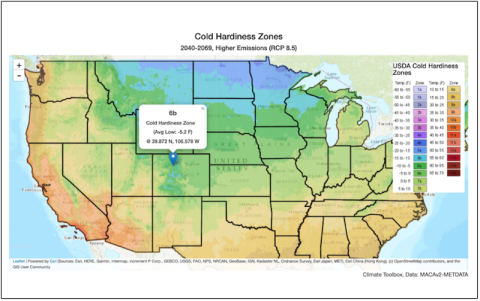
Future Hardiness Zones
Maps of future projections of changes to the USDA’s Plant Hardiness Zone regions
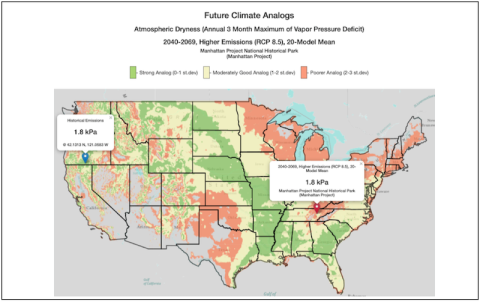
Future Climate Analogs
Maps of areas with a expected similar historical and future climate conditions