Drought
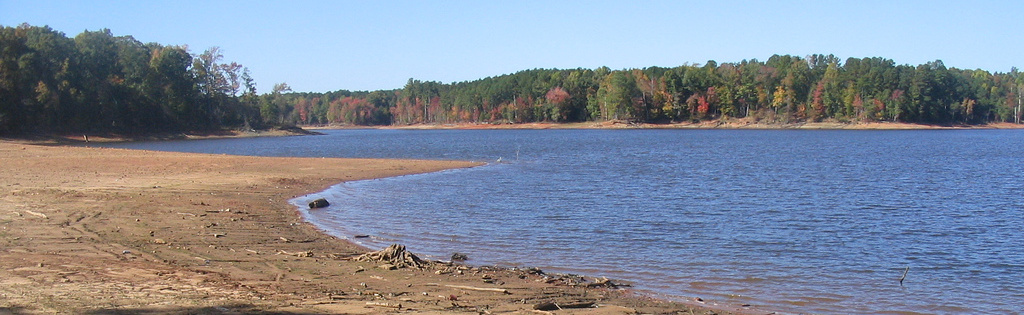
In North Carolina, droughts can occur when we receive below-normal precipitation over the course of weeks to months, which then leads to impacts including to agricultural production, wildfire activity, and water resources such as streamflow, groundwater, and reservoir levels.
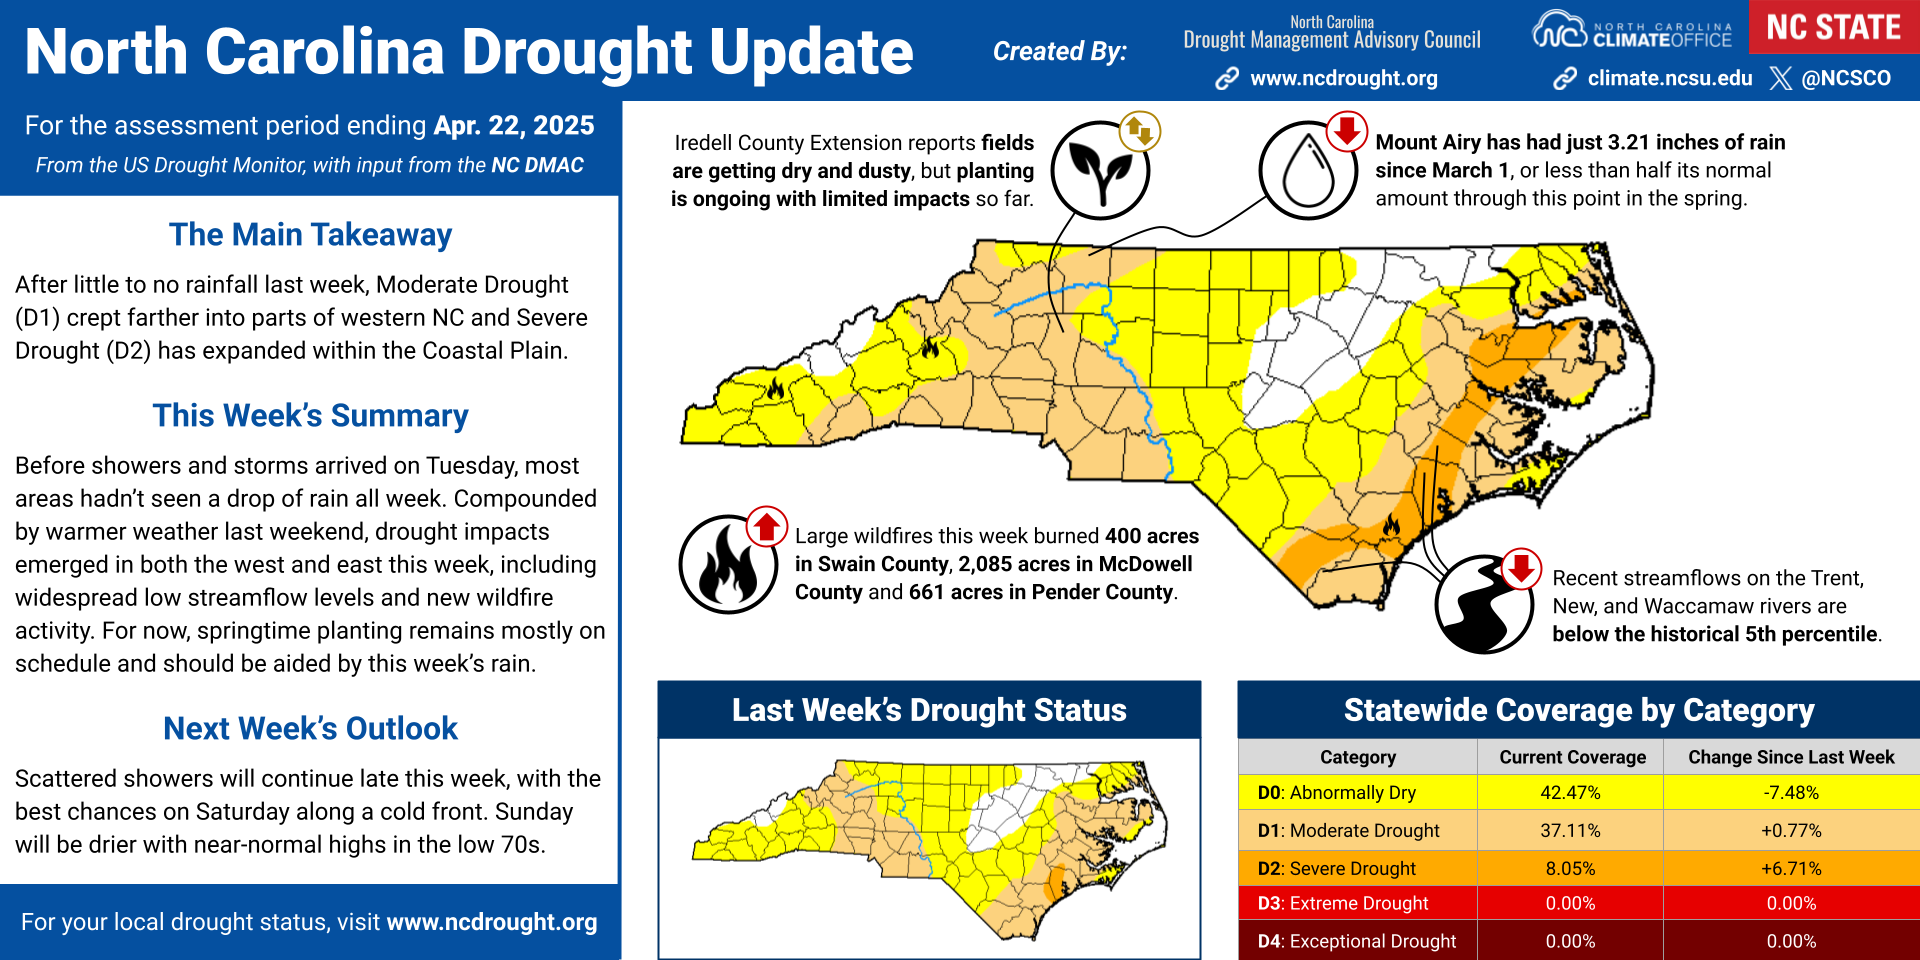
Droughts are a part of our climate, but by definition, they don’t necessarily occur every year at every location across the state. The US Drought Monitor’s classification scheme defines Moderate Drought — the least severe and most common drought category — as corresponding to the driest 20% of historical conditions as assessed using precipitation amounts, water levels, and other objective indicators.
Significant droughts dot our state’s history in the 20th century and earlier, and we’ve seen several in recent decades, ranging from multi-year events such as those from 1998 to 2002 and 2007 to 2009 to short-lived but fast-emerging flash droughts, including the one in June 2024.
Drought Monitoring
Our state drought status is assessed each week by the North Carolina Drought Management Advisory Council (NC DMAC), which includes experts in meteorology, hydrology, meteorology, hydrology, water system management, emergency response, and related subject areas. The NC DMAC is responsible for issuing county-level drought status advisories and making recommendations to the US Drought Monitor.
- Read More: The DMAC Process
As part of a drought communications research project at our office several years ago, we began developing weekly update infographics describing the current drought status, impacts, and recent changes and tendencies. To receive these via email, along with our once-monthly weather outlooks, you can join our listserv using a Google-managed email account or email cndavis@ncsu.edu to be manually added to the group.
Drought Tools
The tools below display many of the same datasets and indicators used in the NC DMAC’s weekly assessments.
Precipitation Data
- Precipitation Deficit Progression: track local rainfall deficits during ongoing and recent drought events
- SRCC’s Integrated Water Portal: precipitation totals, deficits, and drought indices over various time periods
- NDMC Composite Drought Indicators: drought indices at short-term, mid-term, and long-term timescales
Water Resources
- USGS WaterWatch: including real-time, 7-day average, and 28-day average streamflow conditions
- Climate Response Network: groundwater data and site statistics for wells across the country
- Drought Indicator Wells: groundwater data from wells curated by the NC Division of Water Resources
Reservoir Levels
- US Army Corps of Engineers: including water supplies for the Triangle at Falls and Jordan lakes
- Duke Energy: including water supplies for the western Piedmont at Lake James and Lake Norman
- Tennessee Valley Authority: including Fontana Lake and other southern mountain reservoirs
- Cube Hydro Carolinas: including High Rock Lake and other Yadkin River reservoirs in the Piedmont
Agricultural Impacts
- Crop Progress & Condition Reports: weekly reports during the growing season from USDA/NASS
- SPoRT-LIS Soil Moisture: modeled soil moisture information from NASA’s SPoRT-LIS program
- ECONet Soil Moisture: observations and climatology from the State Climate Office’s ECONet stations
Wildfire Danger
- Statewide Fire Danger Map: Adjective Rating forecasts for Fire Danger Rating Areas across the state
- KBDI in the Fire Weather Intelligence Portal: station-based and gridded Keetch-Byram Drought Index data
- North Carolina Wildfire Public Viewer: current wildfire incidents being tracked by NC Forest Service
Other Impacts
- Water Systems Conservation Status: current restrictions implemented by statewide water systems
- CoCoRaHS Condition Monitoring Reports: local drought impacts submitted by citizen scientists
- Drought Impact Reporter Dashboard: sectoral impacts pulled from local daily media reports