Heat Index Climatology
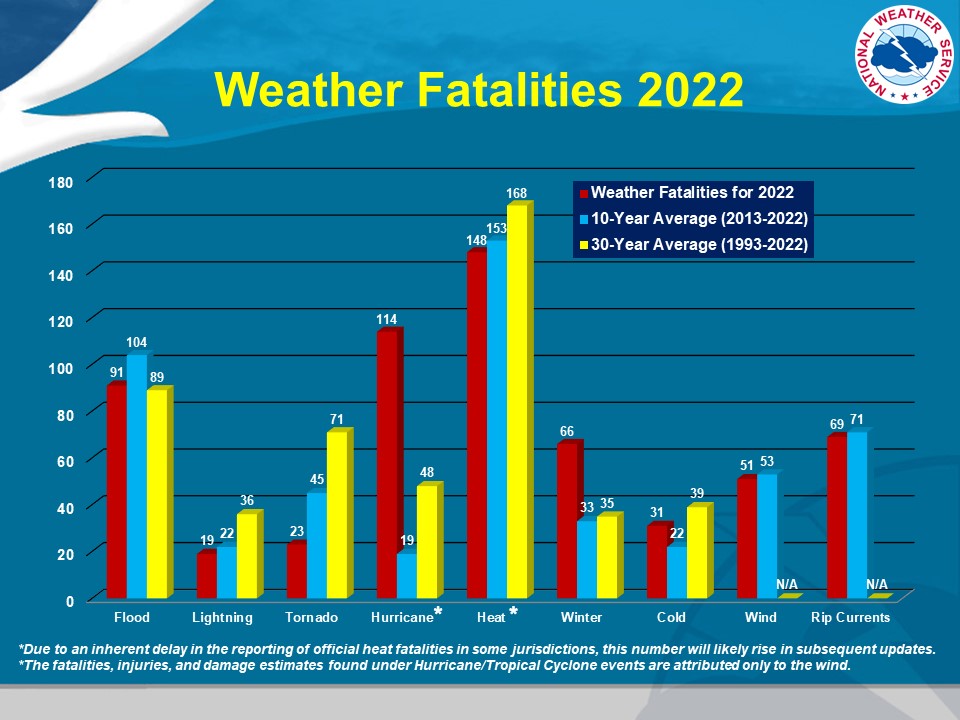
The effects of excessive heat on the human body can be devastating. According to the National Weather Service, over the 30-year period from 1991-2020, there were an average of 141 deaths per year from heat-related causes. This is more than any type of weather event during this period.
Heat Index Calculation
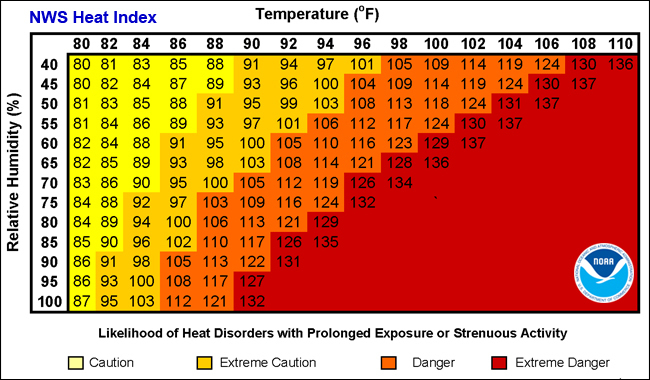
Heat index was devised as a way to determine how warm the outside temperature feels when relative humidity is factored in. Using the form below for various long-term measuring stations, you can retrieve or graph the number of heat index values that fall within certain thresholds. Note that heat index is calculated using the regression equation from Lans P. Rothfusz, and is used by the National Weather Service in their Technical Attachment (SR 90-23).
Heat Index (°F), or HI, is calculated by the regression equation:
HI = -42.379 + 2.04901523*T + 10.14333127*RH - .22475541*T*RH - .00683783*T*T - .05481717*RH*RH + .00122874*T*T*RH + .00085282*T*RH*RH - .00000199*T*T*RH*RH Where T is the air temperature (°F) and RH is the relative humidity (%)
- If RH < 13% and T is between 80°F and 112°F, the following adjustment is made:
     ADJUSTMENT = HI + [(13-RH)/4]*SQRT{[17-ABS(T-95.)]/17}

     SQRT = Square Root
     ABS = Absolute Value
2. If RH > 85% and T is between 80°F and 87°F, the following adjustment is made:
ADJUSTMENT = HI + [(RH-85)/10] * [(87-T)/5]3. If HI < 80°F, than a simpler formula is used:
HI = 0.5 * {T + 61.0 + [(T-68.0)*1.2] + (RH*0.094)}