Cardinal FAQs
GENERAL USE
The list of matches prioritizes stations with the closest proximity to your requested location that measure your requested parameters, and have data available during your requested time period(s). The best-matching stations according to these criteria are listed first.
To further help you identify the best stations for your request, you can view more details about each station by expanding its Station Details or Parameter Details panels. Note that a icon indicates this station may not be representative of your location, or may not have data for all parameters or time periods you requested.
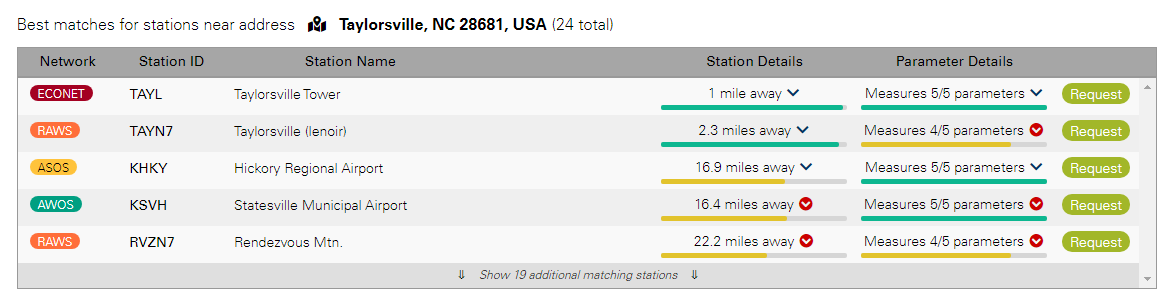
We recognize that in some cases, it may not always be clear which station best represents your location. If you have any questions, or need guidance regarding which stations to select, feel free to reach out to us! (sco@climate.ncsu.edu)
To further help you identify the best stations for your request, you can view more details about each station by expanding its Station Details or Parameter Details panels. Note that a icon indicates this station may not be representative of your location, or may not have data for all parameters or time periods you requested.
We recognize that in some cases, it may not always be clear which station best represents your location. If you have any questions, or need guidance regarding which stations to select, feel free to reach out to us! (sco@climate.ncsu.edu)
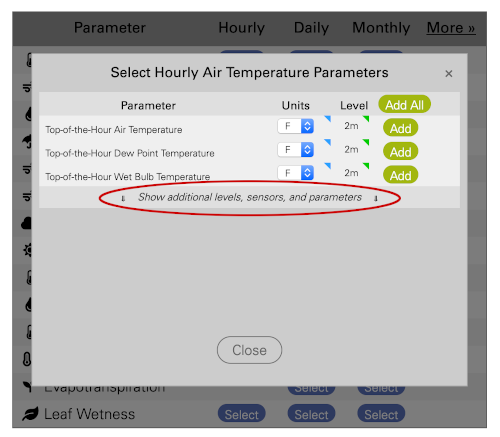
Cardinal defaults to the parameters most often requested, however additional parameters can be accessed by clicking on the “Show additional levels, sensors, and parameters” link toward the bottom of the parameter panel.
Any saved requests will be archived for up to 2 weeks before being removed from the queue.
Your data requests can be found on your “My Cardinal Requests” page, including requests you’ve saved, but haven’t yet submitted. When expanding the accordion for a given saved request, you’ll see a button to continue with your request.
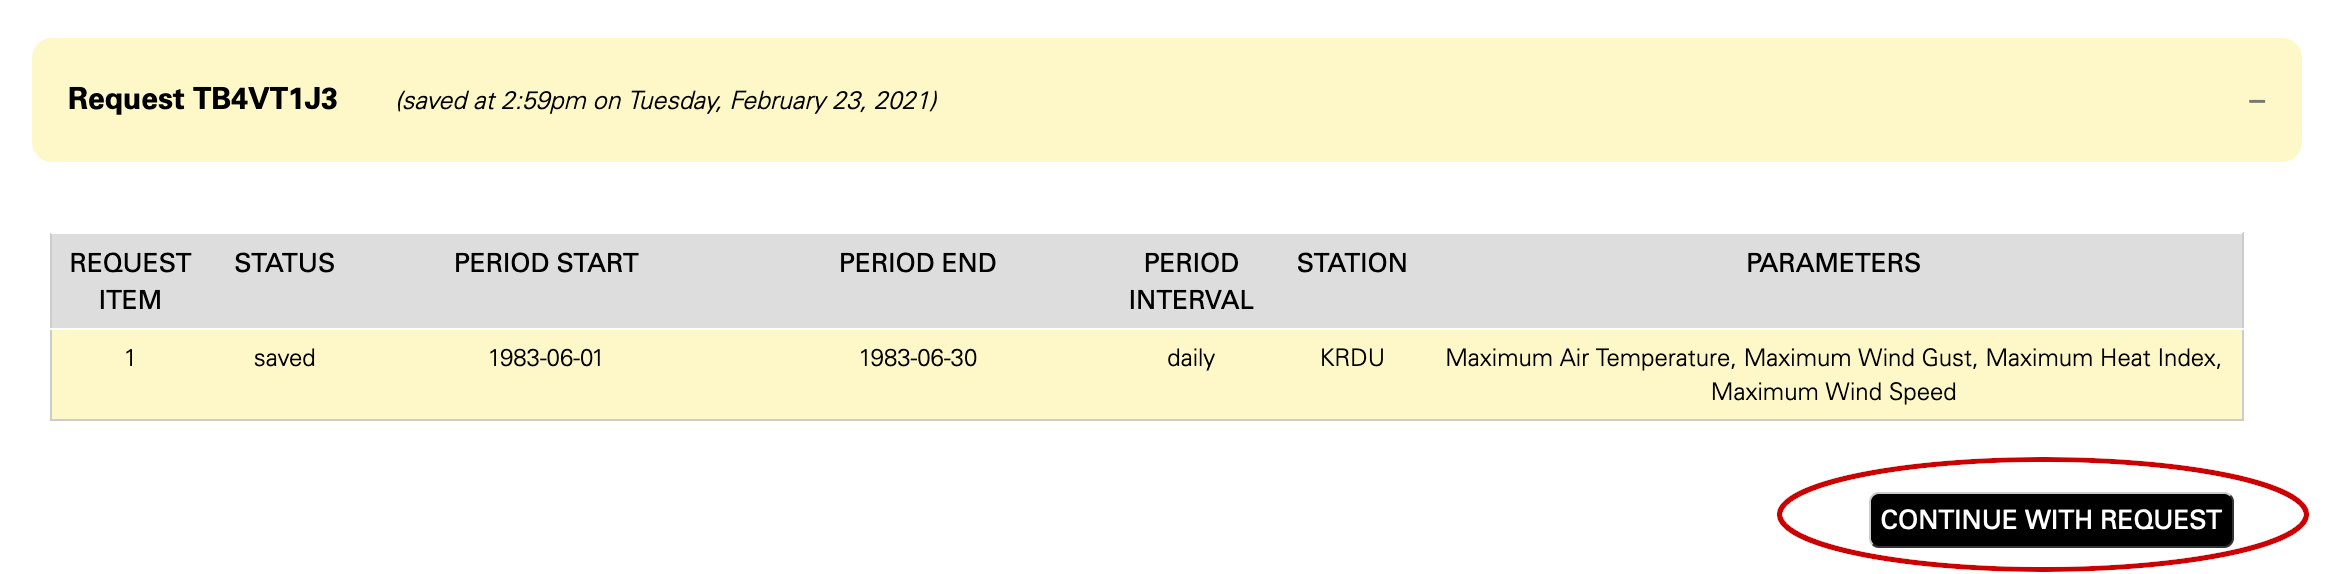
This page also contains your profile information, as well as a snapshot of your data usage and number of requests you’ve submitted for the month.
Your data requests can be found on your “My Cardinal Requests” page, including requests you’ve saved, but haven’t yet submitted. When expanding the accordion for a given saved request, you’ll see a button to continue with your request.
This page also contains your profile information, as well as a snapshot of your data usage and number of requests you’ve submitted for the month.
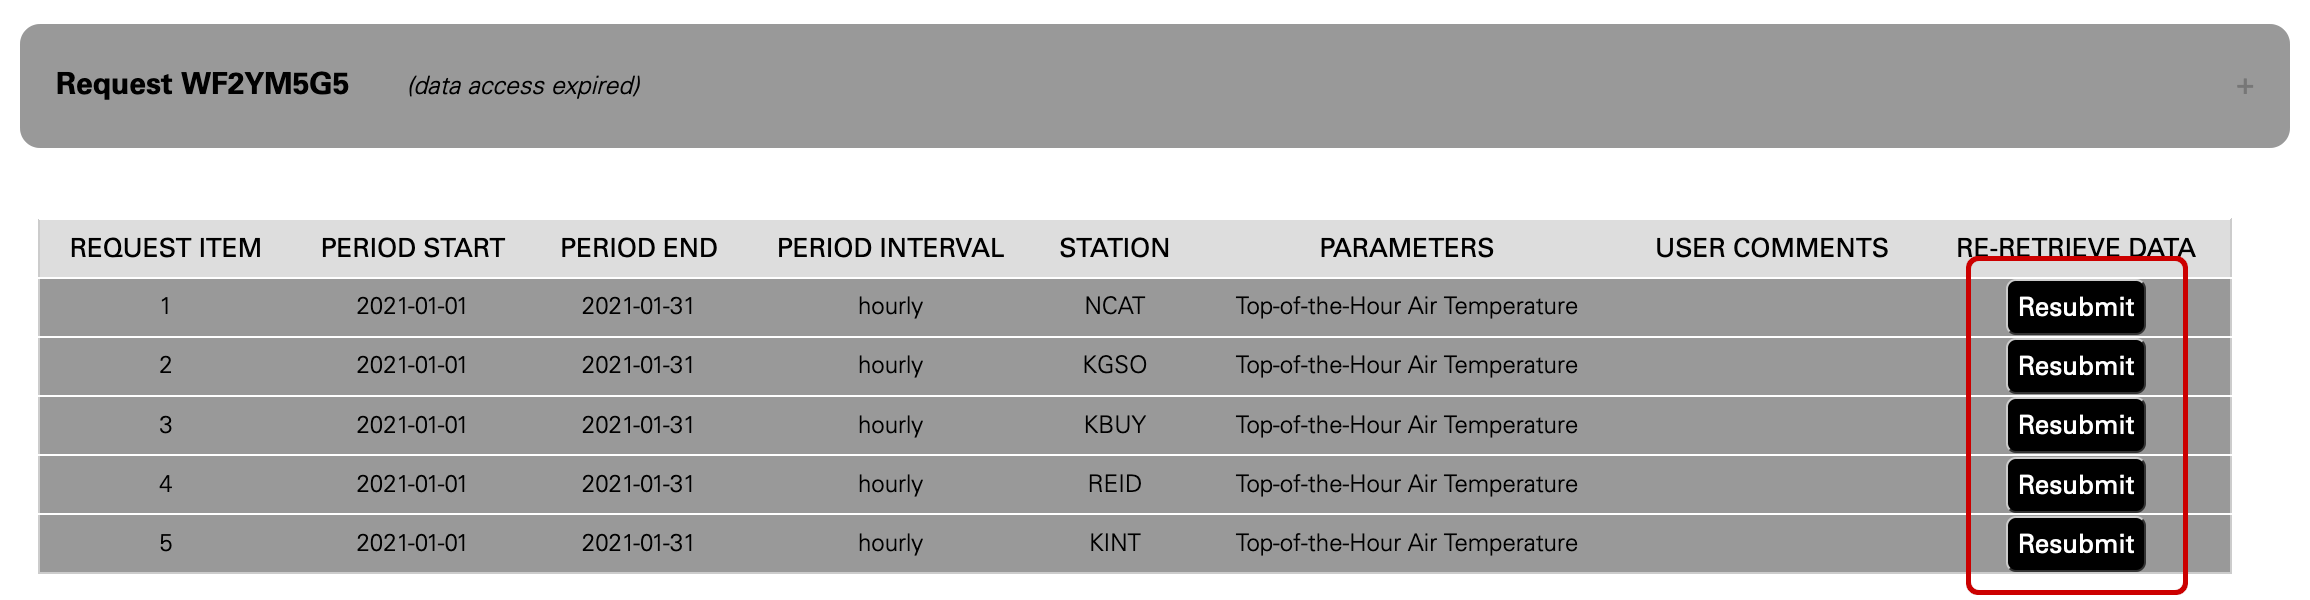
All of your past data requests can be found at the bottom of your “My Cardinal Requests” page. When expanding the accordion for a past request, you’ll see buttons associated with each request item to resubmit the request for data.
For periods that include both a date and time, any aggregated data (i.e. maximum, minimum, average, or accumulated values) are valid for the interval ending at the datetime shown.
As an example, say you submitted a request for hourly precipitation data from Lake Wheeler Road Field Lab. The one-hour accumulated precipitation valid at 8:00am on January 15, 2021 (i.e. associated with the timestamp 2021-01-15 08:00) would use observations between 7:01am to 8:00am.
For periods without a time — such as when daily or monthly data is requested — the aggregated data is valid for that entire period.
As an example, if you were to submit a request for daily maximum temperature from UNC Asheville Weather Tower, a daily maximum temperature valid for March 10, 2021 would use observations between 12:00am and 11:59pm on March 10.
If you were to request monthly precipitation from NC A&T State University Research Farm, the monthly accumulated precipitation valid for February 2021 would use observations beginning February 1, 2021 at 12:00am and ending February 28, 2021 at 11:59pm.
Should you publish findings based on this data, please use the following citation (with the date changed to reflect the save date on the data file):
North Carolina State Climate Office, NC State University. Cardinal [data retrieval interface] available at https://products.climate.ncsu.edu/cardinal/request. Accessed Month DD, YYYY.
TROUBLESHOOTING
One of the core areas of the State Climate Office’s mission is to serve North Carolina by providing the most accurate climate information available across the state to those who need it. While past data dissemination extended to weather stations outside of state borders, we remain true to our mission, and are focusing our efforts where our expertise lies to ensure this mission succeeds. Should you need data from weather stations beyond North Carolina, we invite you to explore the many resources below:
Any data values marked with an “NA” represent an observation that is not within the station’s period of record. “NA” values may also be seen in situations where a particular instrument hadn’t yet been installed that measured a given parameter – even if that station measured other parameters at that time, or eventually measured the weather parameter in question.
Any observations marked with “MV” indicate a missing value – whether due to a issue with a particular sensor that would otherwise be measuring at that time, or the failure of an entire observation to transmit as expected.
Any observations flagged with “QCF” indicate the value failed our quality control checks.
Here are a couple of possibilities that may explain the data retrieval issue you’re experiencing:
Our office will be notified whenever data retrieval for a request fails, and will work to resolve any issues that may have occurred. Should you have any questions or concerns about a particular request, feel free to contact our help desk directly (help@climate.ncsu.edu), and be sure to include your request ID in the response.
- The station you requested does not have any observations for the time frame you selected, either because it was outside of that station’s period of record, or because that station was missing observations over that period.
- The parameter you requested isn’t measured at the station you wished to get data for, or wasn’t available over your chosen time frame.
- An error occurred while attempting to retrieve the data you requested.
Our office will be notified whenever data retrieval for a request fails, and will work to resolve any issues that may have occurred. Should you have any questions or concerns about a particular request, feel free to contact our help desk directly (help@climate.ncsu.edu), and be sure to include your request ID in the response.
Scout is a wonderful tool within Cardinal that serves as a guide for exploring weather stations across North Carolina. Users can search for stations by ID, name, or location to view station metadata, data availability, and current conditions. Scout also allows users to retrieve recent data, including hourly data for the past 2 months, daily data for the past year, and monthly data for the past 10 years. Head on over to Scout to get started!
Any general questions you have about using Cardinal or the data returned after submitting a request can be directed to the main SCO email address at sco@climate.ncsu.edu.
Should you have any issues with your request, we suggest you contact our help desk directly (help@climate.ncsu.edu), and be sure to include your request ID in your response.
Should you have any issues with your request, we suggest you contact our help desk directly (help@climate.ncsu.edu), and be sure to include your request ID in your response.
DATA AND NETWORKS
The NC ECONet is maintained by the State Climate Office, and was developed in cooperation with state and federal agencies in order to record weather and climate observations for a variety of applications. ECONet stations measure unique parameters that most other stations don’t have – namely, solar radiation, photosynthetically active radiation, station pressure (most other stations measure sea level pressure), soil temperature, soil moisture, and leaf wetness. In addition, ECONet stations have one-minute observations, while most other networks have either hourly or daily.
Click here to learn more about the NC ECONet!
Click here to learn more about the NC ECONet!
While our office archives data from the many networks listed below, we cannot guarantee the availability and accuracy of observations from these stations, beyond those from the ECONet and ECOExt stations that we manage.
- North Carolina Environment and Climate Observing Network (ECONet): ECONet stations are maintained by the State Climate Office, whose sensors measure a variety of atmospheric and soil parameters. Such parameters include air temperature, humidity, winds, precipitation, and pressure, as well as solar radiation, soil temperature, and soil moisture. Observations are generally available each hour, historically, however one-minute observations began coming online in 2006. Click here for more information.
- ECONet Extended (ECOExt): We also manage several other weather stations that do not include the full set of sensors as a typical ECONet site, but that do still have one-minute observations. These stations help fill in geographical gaps in areas where a full ECONet station would not be possible or practical, such as the Mile High Swinging Bridge at Grandfather Mountain.
- NWS Cooperative Observer (COOP) Network : COOP stations have automated sensors maintained by National Weather Service which measure temperature and precipitation conditions. Volunteer observers visit COOP stations on a daily basis (at the same time each day), record the maximum and minimum temperature and amount of precipitation for the previous 24 hours, and then reset the sensors. COOP data make up the bulk of the historical climate record – several stations in NC have records for over 100 years. Current observations are available for many stations on the next day, while observations from others can often be delayed. Click here for more information.
- U.S. Climate Reference Network (USCRN): The USCRN is designed for the express purpose of detecting the national signal of climate change by means of maintaining high-quality and well-calibrated climate observations of temperature and precipitation. Click here for more information.
- NWS Automated Surface Observing System (ASOS): ASOS stations are typically located at airports, and the National Weather Service maintains their sensors. While these stations are automated, human observers are present at the larger airports to oversee the sensor measurements. ASOS stations have hourly measurements of temperature, dew point, sea level pressure, visibility, “weather type” winds, humidity, precipitation, and cloud cover. “Special” observations are also transmitted when the weather meets certain criteria that aviation operations are sensitive to, such as low visibility or a low cloud base height. Click here for more information.
- NC DOT/FAA Automated Weather Observing System (AWOS): Similar to ASOS, AWOS stations are usually located at airports. AWOS sensors are installed and maintained by the NC Department of Transportation Aviation Division following FAA guidelines. AWOS stations take measurements every twenty minutes, with the “hourly observation” being the one closest to the top of the hour without extending into the next hour. Parameters measured are similar to those at ASOS stations, but often lacking in precipitation. Historical data for these systems are limited, but the SCO has archived the observations since 2001. Click here for more information.
- Remote Automated Weather Stations (RAWS): RAWS stations provide weather data that assists land management agencies with a variety of projects, such as monitoring air quality and rating fire danger. RAWS stations record hourly measurements of temperature, winds, precipitation, dew point, humidity, and solar radiation, as well as unique parameters useful for monitoring fire danger – namely, fuel temperature and fuel moisture. Click here for more information.
- NOAA’s National Ocean Service (NOS): NOS stations are located on piers and marinas, and record weather and water conditions. There are limited historical observations for these sensors.Click here for more information.
- SCAN: SCAN stations focus on the agricultural areas of the United States. Maintained by the National Resources Conservation Service, the SCAN sites are used to monitor drought development, for soil classification and moisture assessment, for input into global circulation models, and for various water table assessments that are important to local crops, woodlands, and wetlands. Click here for more information.
- Buoy or CMAN: Offshore buoys and CMAN stations record hourly measurements of weather (air temp, dew point, sea level pressure, visibility, winds, humidity) and water (wave height, water temperature, dominant / average wave period) conditions off the coast. Click here for more information.
Both the average and the mid-range are measures of central tendency, and will be approximately equal. We use these terms to mathematically distinguish between how they’re calculated — the average indicates a mean of 24 hourly values for a given day, whereas the mid-range represents the daily maximum plus the daily minimum, divided by two.
Prior to the fall of 2001, ECONet stations only archived hourly averages. That year, SCO instrumentation meteorologists upgraded the existing stations so that instantaneous hourly measurements could also be recorded.
One-minute observations at ECONet stations were not available until the summer of 2005 (at the earliest) when new data loggers began to be deployed. Each station in existence at the time was slowly upgraded with the new data logger over the next few years. All new stations constructed after this period were automatically set up with the one-minute data loggers.
One-minute observations at ECONet stations were not available until the summer of 2005 (at the earliest) when new data loggers began to be deployed. Each station in existence at the time was slowly upgraded with the new data logger over the next few years. All new stations constructed after this period were automatically set up with the one-minute data loggers.
Precipitation observations were not archived at ASOS stations until they were commissioned in 1996. This means for every ASOS station with a record dating back prior to 1996, precipitation is not available.
An information page can be found on our website detailing how each parameter was calculated.
Our CLOUDS API is ideal for power users who routinely need access to large amounts of data for applications and/or research purposes. This service uses URL arguments to form an API Data Query — five of which are required (user hash code, location, parameters, start datetime, and end datetime), along with additional optional arguments such as output format and parameter attributes.
To learn more about this service or sign up for an API account, please visit the CLOUDS API home page.
To learn more about this service or sign up for an API account, please visit the CLOUDS API home page.