Mainland Model
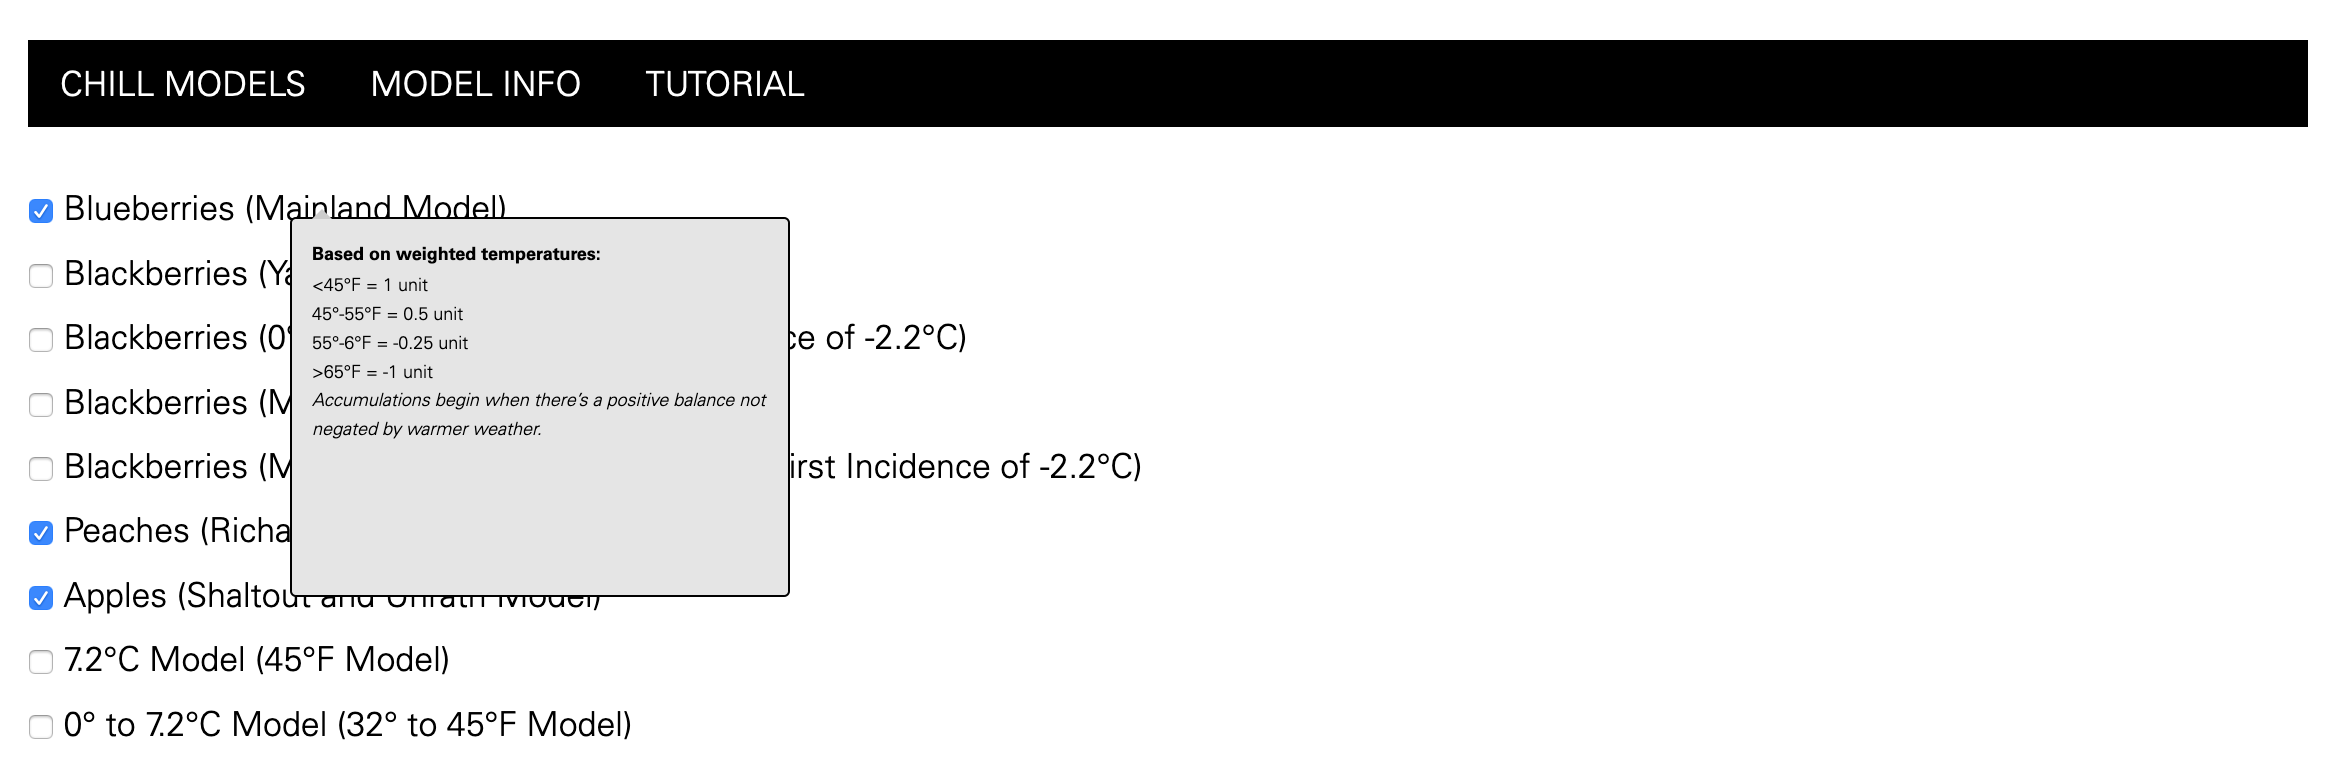
Chilling Inception: Model accumulations begin when the model has a positive balance that is not negated by warmer weather
Accumulation Per Hour: Temperatures <45°F = 1 unit; 45° to 55°F = 0.5 units; 55° to 65°F = -0.25 units; >65°F = -1 unit
Once 800+ chill hours have accumulated, points are no longer negated for temperatures 55°F and above.
Model ends February 28 at midnight.
Yazetti and Clark Model
Chilling Inception: First Incidence of -2.2°C (28°F)
Accumulation Per Hour: Temperatures <7°C (45°F) = 1 unit
0° to 7°C (32° to 45°F) Model with First Incidence of -2.2°C (28°F)
Chilling Inception: First incidence of –2.2°C (28°F)
Accumulation Per Hour: Temperatures between 0° and 7°C (32° and 45°F) = 1 unit
Modified Richardson Model
Chilling Inception: The day in the fall when the maximum negative number of chill units above 15.9°C (60.6°F) was accumulated
Accumulation Per Hour: Temperatures between 0° to 9.1°C = 1 unit; 9.2° to 12.4°C = 0.5 units; 12.5° to 15.9°C = 0 units; 16° to 18°C = –0.5 units; >18°C = –1 units
Warmund and Krumme — Modified after the Richardson Model with First Incidence of -2.2°C (28°F)
Chilling Inception: First incidence of –2.2°C (28°F)
Accumulation Per Hour: Temperatures between 0° to 9.1°C = 1 unit; 9.2° to 12.4°C = 0.5 units; 12.5° to 15.9°C = 0 units; 16° to 18°C = –0.5 units; >18°C = –1 units
Richardson Model (a.k.a. Utah model)
Chilling Inception: The day in the fall after the maximum negative number of chill units above 15.9°C (60.4°F) was accumulated
Accumulation Per Hour: Temperatures between <1.4 °C = 0 units; 1.5 to 2.4 °C = 0.5 units; 2.57deg; to 9.1°C = 1 unit; 9.2° to 12.4°C = 0.5 units; 12.5° to 15.9°C = 0 units; 16° to 18°C = –0.5 units; >18°C = –1 unit
NC peach growers note that the Mainland model for blueberries may be better suited for our state.
Shaltout and Unrath Model
Chilling Inception: The day in the fall after the maximum negative number of chill units above 15.9°C (60.4°F) was accumulated
Accumulation Per Hour: Temperatures ≤-1.1°C = 0 unit; -1.0° to 1.6°C = 0.5 units; 1.7° to 7.2°C = 1 unit; 7.3° to 13.0°C = 0.5 units; 13.1° to 16.5°C = 0 units; 16.6° to 19.0°C = -0.5 units; 19.1° to 20.7°C = -1 unit; 20.8° to 22.1°C = -1.5 units; 22.2° to 23.3°C = -2 units
Suggested rest completion at 1200 accumulated units for Starkrimson Delicious apples
7.2°C (45°F) Model
Chilling Inception: The day in the fall after the maximum negative number of chill units above 15.9°C (60.6°F) was accumulated
Accumulation Per Hour: ≤7.2°C = 1 unit
0° to 7.2°C (32° to 45°F) Model
Chilling Inception: The day in the fall after the maximum negative number of chill units above 15.9°C (60.6°F) was accumulated
Accumulation Per Hour: 0° to 7.2°C = 1 unit
This page contains information to assist you in retrieving chill hour accumulations for locations across North Carolina, including detailed information regarding the underlying datasets used in the calculations, as well as step-by-step instructions for using the tool and associated screenshots.
DATA RESOURCES
Observed temperatures used to calculate the chill hour accumulation are retrieved from Real-Time Mesoscale Analysis (RTMA) data, while forecast temperatures are retrieved from the National Digital Forecast Database (NDFD).
The latest RTMA grids are downloaded to the NC SCO’s servers each hour, and we maintain a rolling 12-month archive. As each new grid is downloaded, it is subset to a region around North Carolina. In rare instances, a grid is unavailable for the requested download time, and, while our scripts automatically check to see if the previous hour was missing and tries to re-download it, there may occasionally be missing hours.
NDFD forecasts are retrieved on-the-fly via the National Weather Service’s API once you’ve chosen your desired location.
INSTRUCTIONS
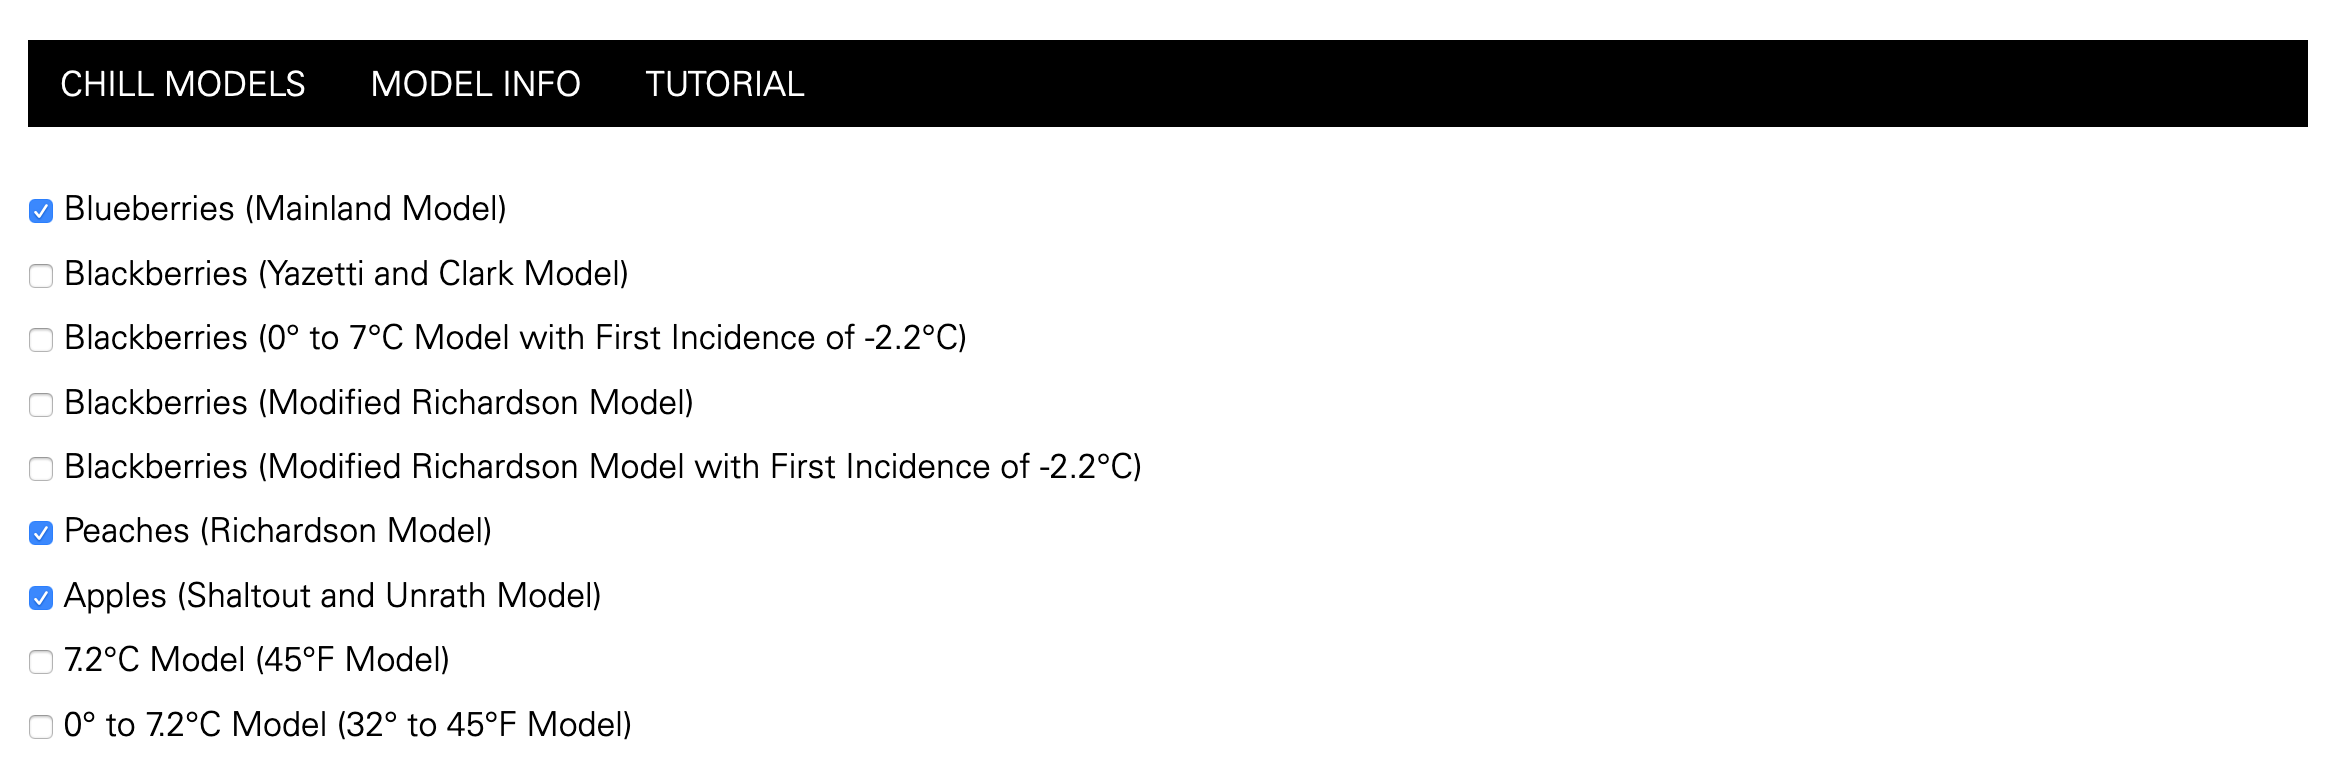
Step 1: Select a Model
With the North Carolina Chill Model tool, you have the option of choosing from a variety of temperature models specific to fruits grown across the state, or from generic temperature models. Note you can select any number of models listed:
By hovering over each model in this list, you can see more details regarding how that model calculates chilling hours:
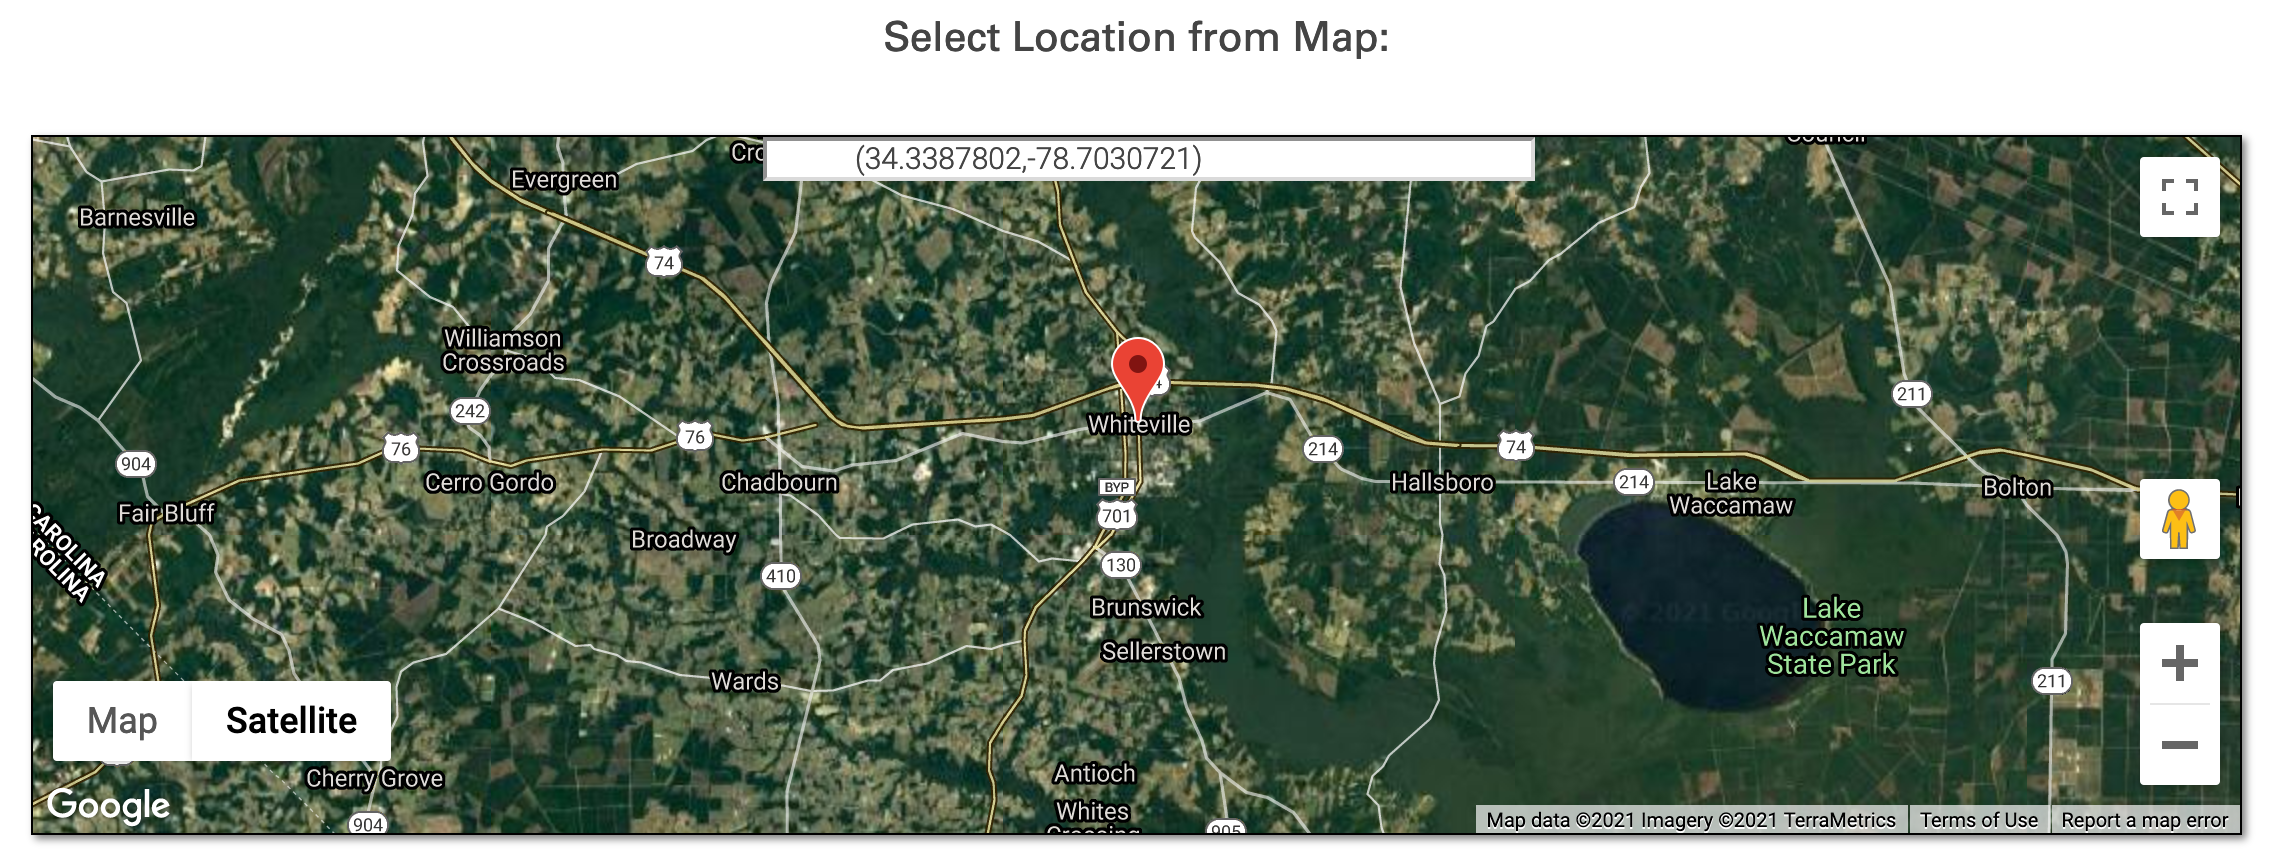
Step 2: Select a Location
Next, select a location by clicking on the map or typing an address into the address bar. Note this map has zoom and pan features to assist you in finding locations of interest.
Step 3: Submit!
Once a location and at least one model has been selected, the “Submit” button will turn red. Click this button to retrieve the output.
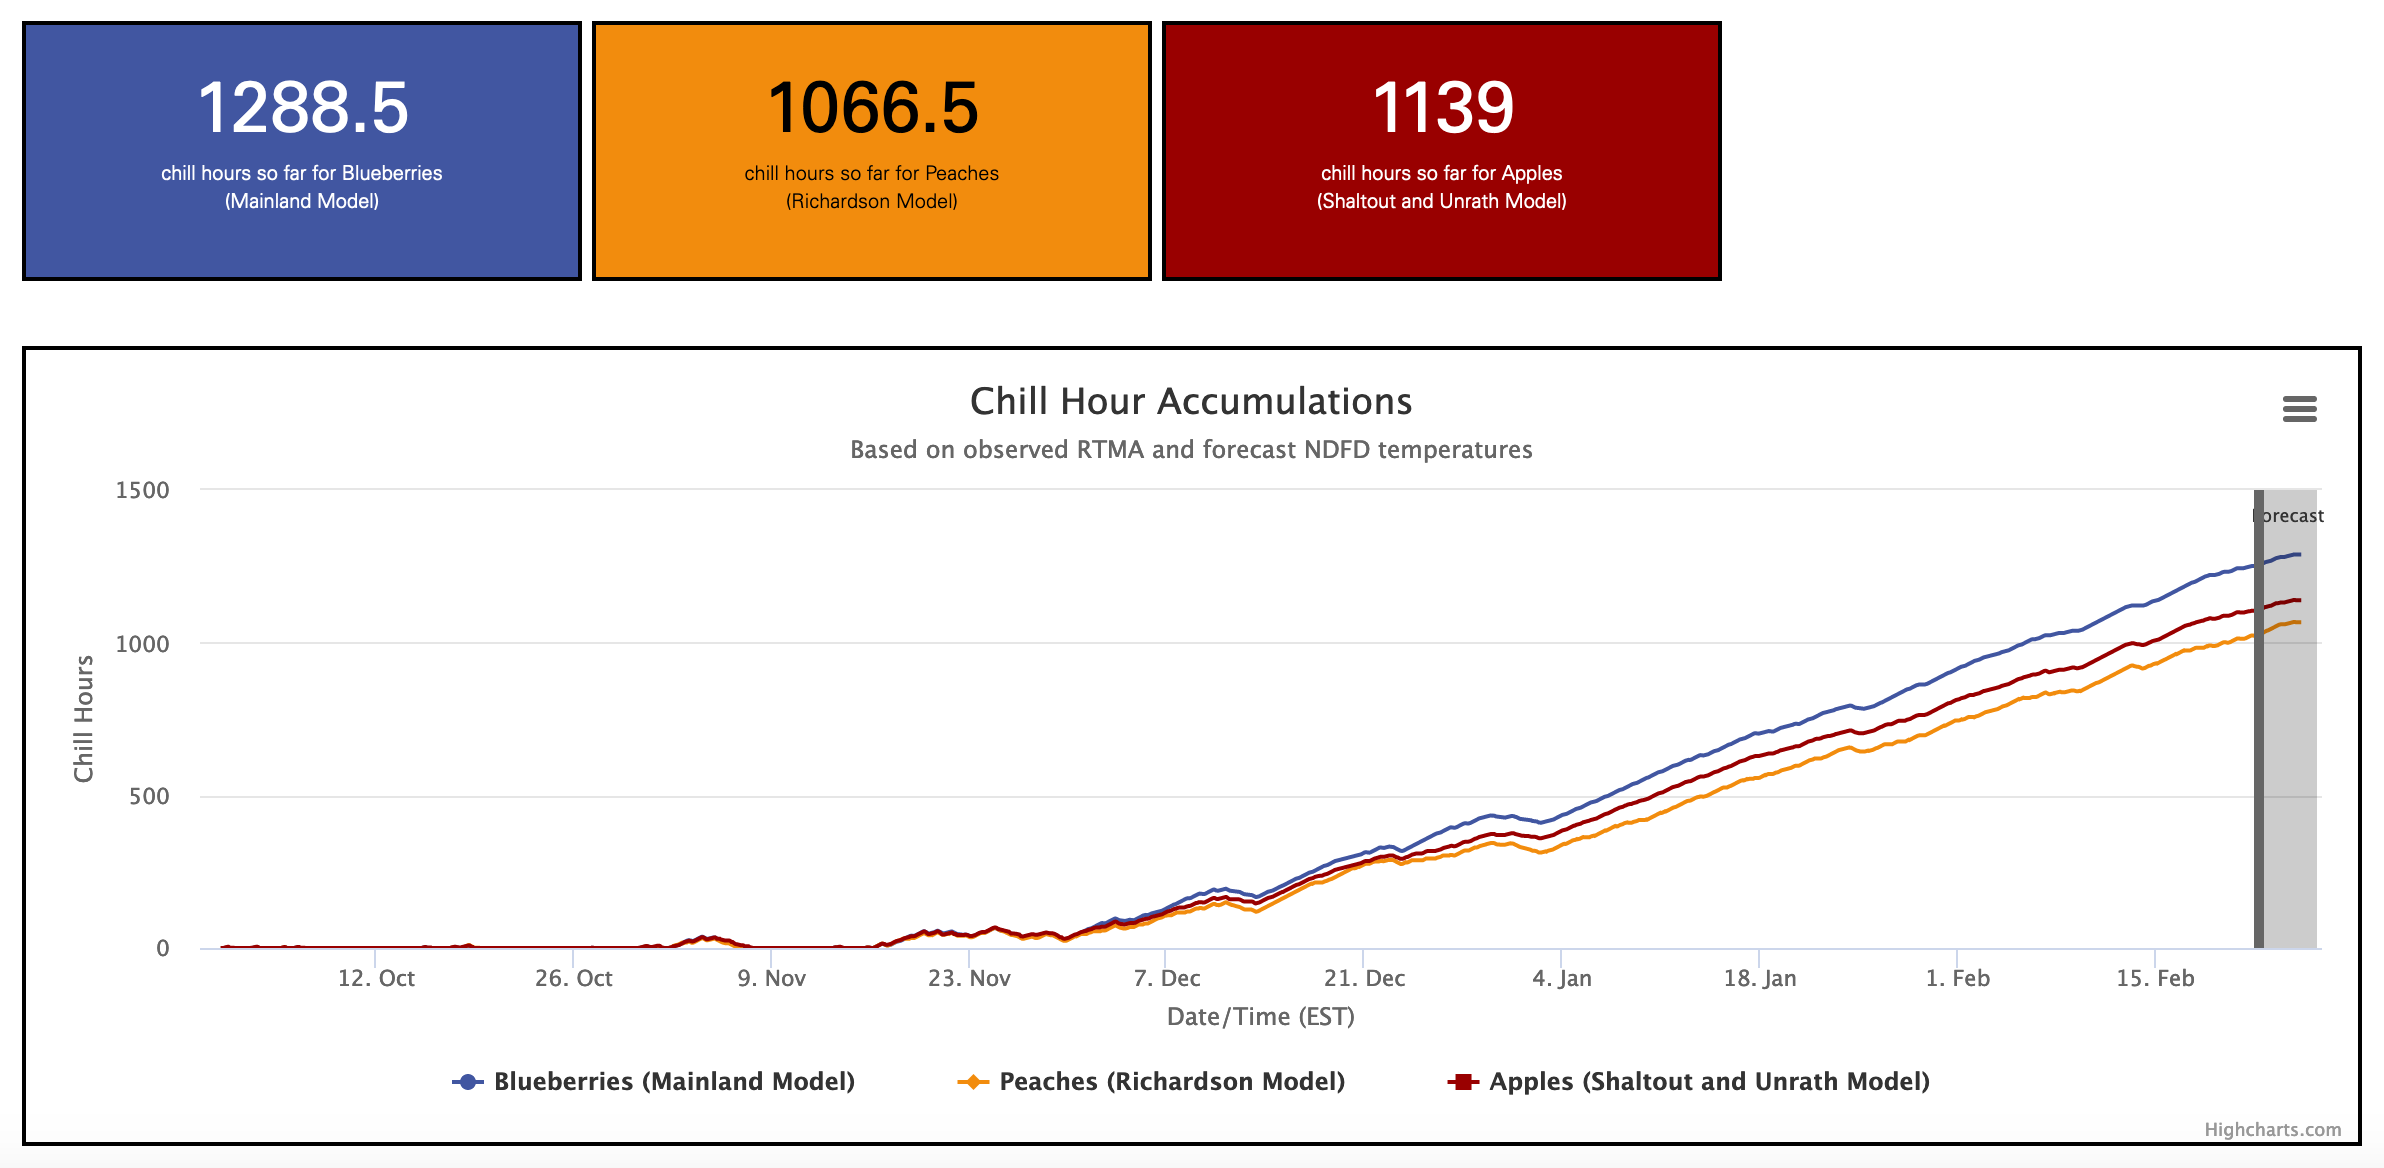
Output
Once the page has been submitted, you will see several “quick look” boxes depicting the total number of chilling accumulations so far this season for each model, as well as a graph depicting the hour-by-hour chilling accumulations.
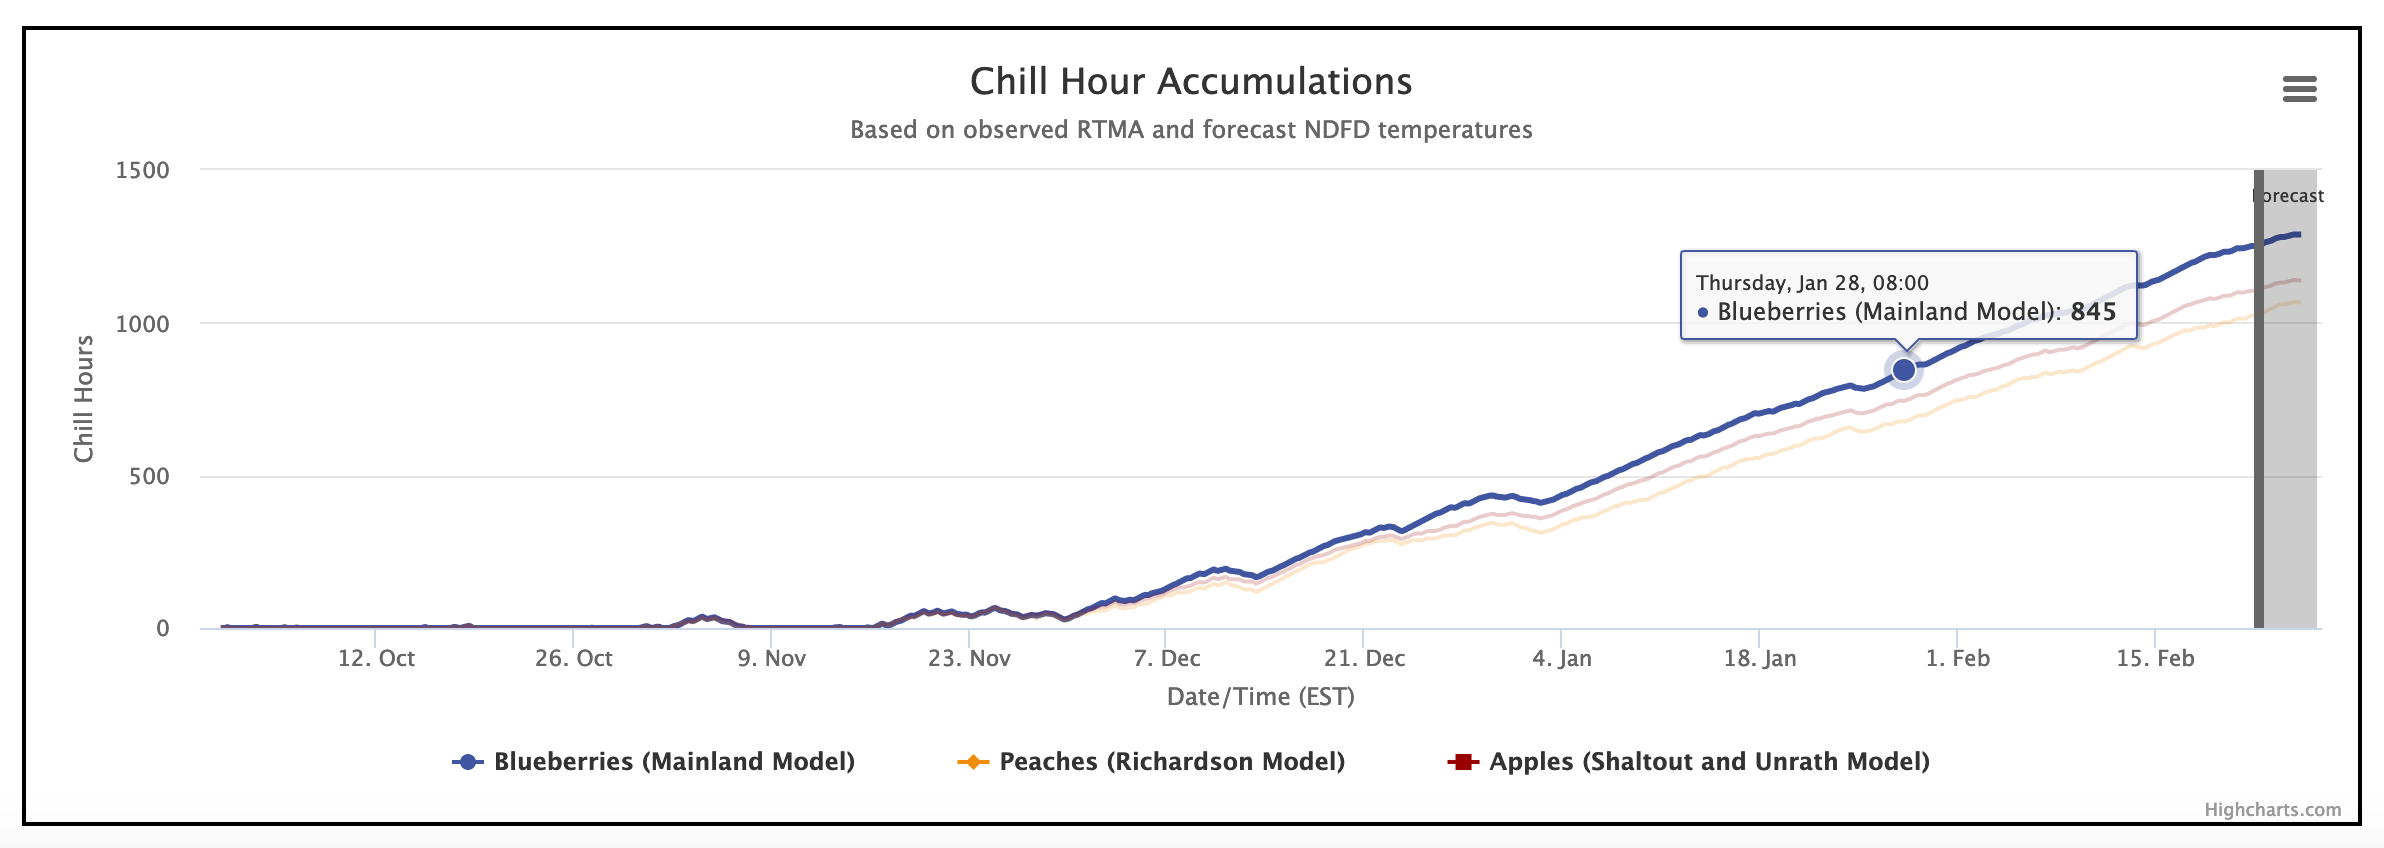
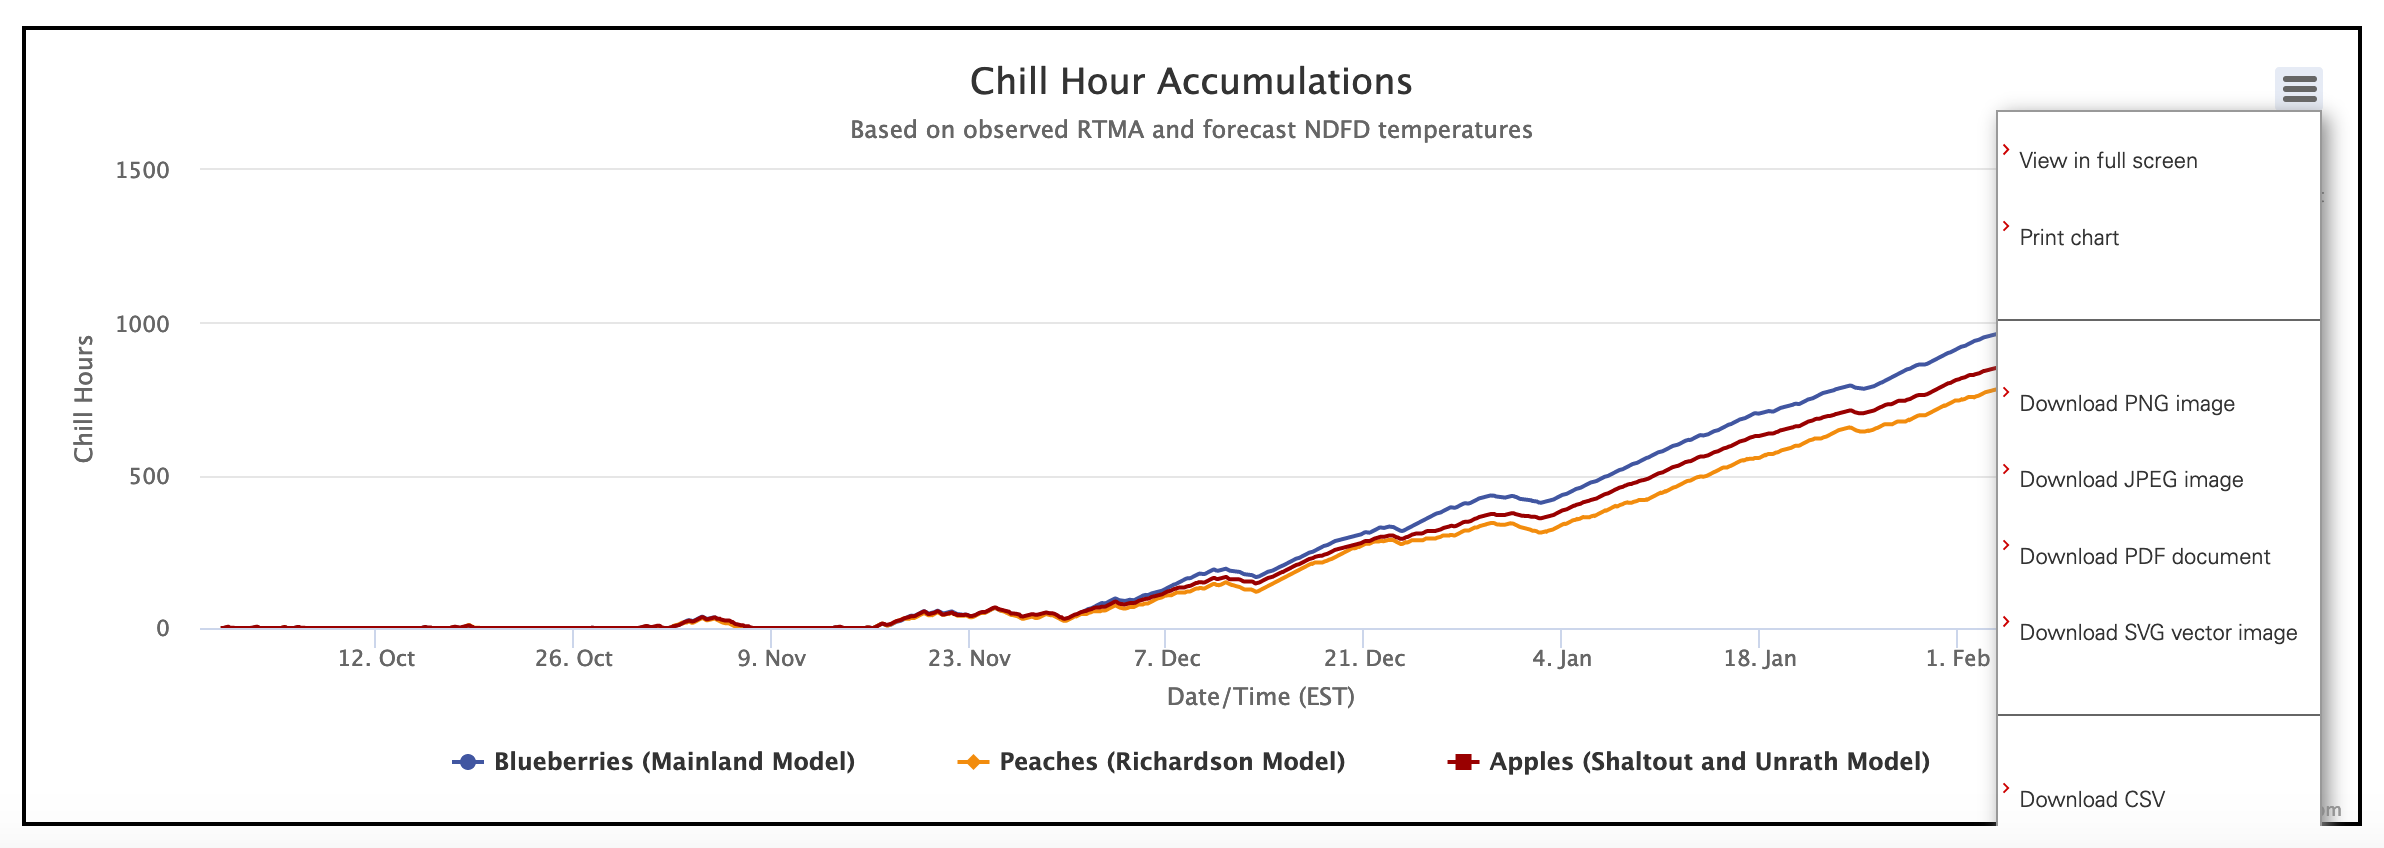
Note you can hover over the graph to see detailed information for a given model on a specific date, and can save the output in several formats, including a CSV.
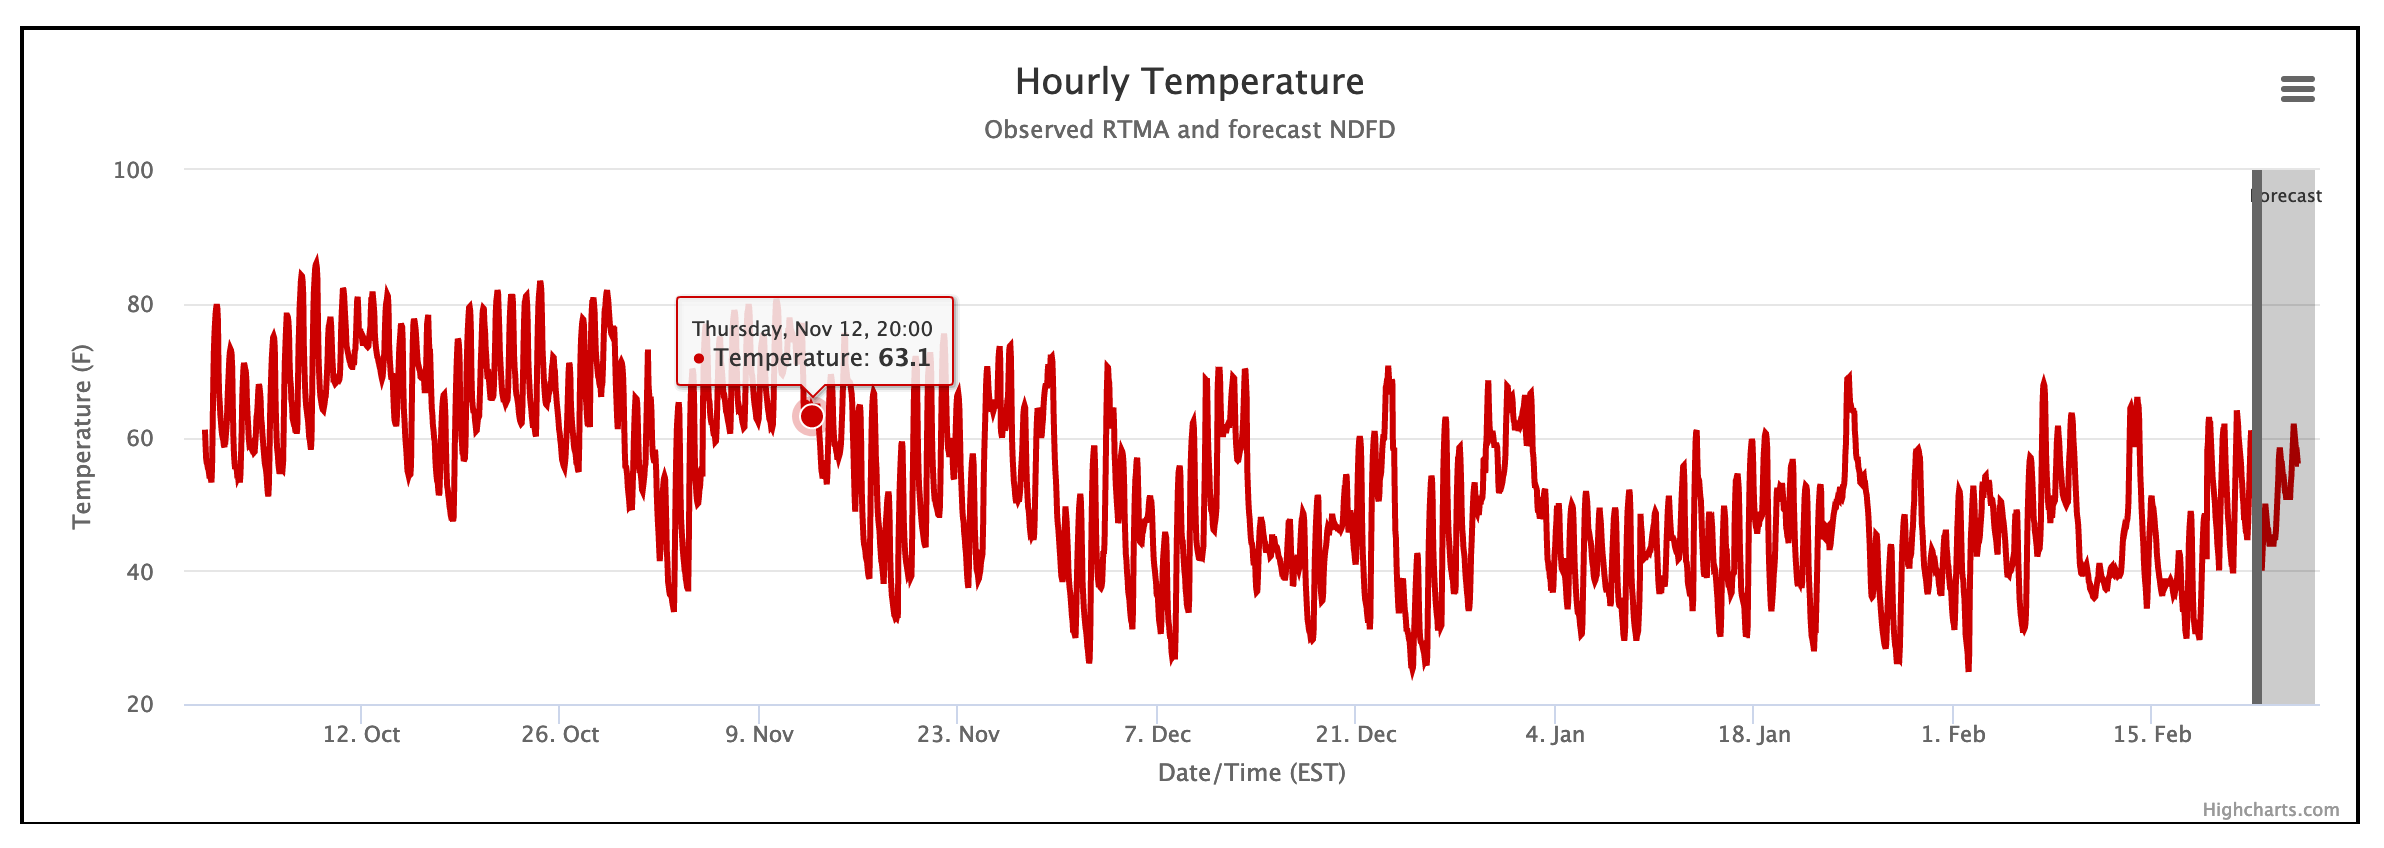
The second graph on the page depicts the temperature data from which the chill hour accumulations are based. Observed temperatures originate from RTMA, while forecast temperatures are generated by NDFD.