Thrips Infestation Predictor for Cotton
April 27 2026: Additional data updates have been made to this tool. Questions? Email us at help@climate.ncsu.edu
The Thrips Infestation Predictor for Cotton uses weather data to make predictions of (1) thrips dispersal timing, (2) Cotton growth affecting seedling susceptibility, and (3) injury risk that results from thrips dispersal and seedling susceptibility occurring at the same time. Running this tool requires users to enter a planting date (defaults to the current date) and a location using the map below. Additionally, users can adjust how many days to run and display model output.

About This Tool
The Thrips Infestation Predictor for Cotton uses weather data to make predictions of:
- Thrips dispersal timing,
- Cotton growth affecting seedling susceptibility, and
- Injury risk that results from thrips dispersal and seedling susceptibility occurring at the same time.
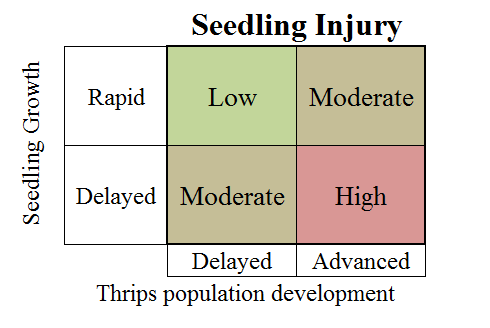
Cotton injury results from thrips infesting and feeding on susceptible seedlings. How much infestation occurs at any given time depends on when thrips disperse from their overwintering hosts into cotton in the spring and the size of the dispersing thrips population, which depend on the winter and spring weather. How much injury results from the infestation depends on whether infestation occurs during the period when seedlings are susceptible to injury, which is between emergence and 4-5 true leaves. The length of this period depends on how rapidly the seedlings grow which also depends on the weather.
Seedling injury results from these two drivers simply as follows: more infestation means more injury for a given amount of seedling susceptibility and more susceptibility means more injury for a given amount of infestation.
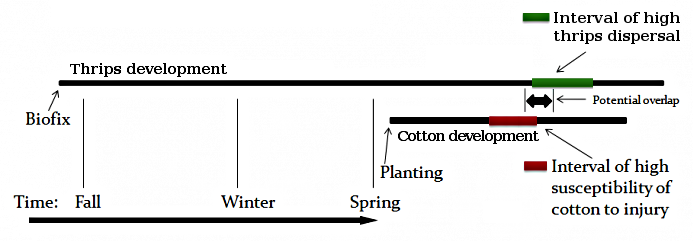
Seedling growth and thrips dispersal are both functions of the weather. The size and timing of the tobacco thrips population dispersing from winter hosts into crops, including cotton, depends on winter and spring temperatures and precipitation, Cotton growth and the interval over which seedlings are susceptible depends on temperatures after planting and on the availability of adequate soil moisture to support seed germination and growth.
The mathematical functions that the tool uses to relate dispersal and susceptibility to weather are illustrated below. Seedling susceptibility begins at zero and increases after seeds are planted, reaching a maximum and then declines. Thrips dispersal begins at a low level and shows several "peaks" during the warm season. Each peak is associated with one generation of adult thrips. Dispersal also reaches an overall maximum and then declines. Injury is represented below as the blue area under a curve. This curve is a weighted product of the susceptibility and dispersal functions.
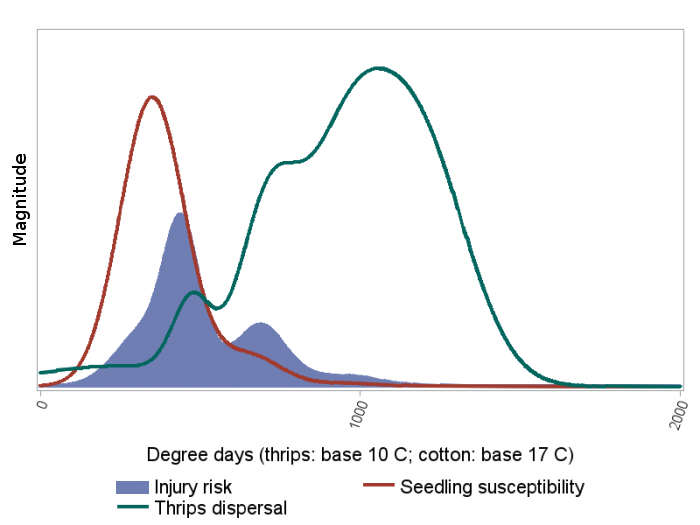
The functions shown above are drawn on a degree-day scale. How many degree-days accumulate on a given calendar day depends on the temperature. The tool calculates weather-based values using real-time data, so that you can see not only when things may be happening, but also for how long. For example, injury will be greater if cotton development is slow during cold weather, provided thrips are around to infest the seedlings.
This is why the blue area under the curve above is meaningful. Injury results from something you might call "injury-susceptibility days,"which can accumulate just as degree-days do. In other words, the longer the period that seedlings are being injured (which depends simultaneously on the seedlings' being susceptible, and the injuring thrips being present), the more injured the plants will be in the end. Output of the tool is expressed as a "cumulative injury risk" function that reflects this, and the predicted cumulative injury is what is used to generate the charts that color-code risk by date.
Acknowledgments
Syngenta Crop Protection for financial support and contributing data on thrips infestations and cotton seedling damage ratings over many sites and years.
Cotton Incorporated and USDA NIFA AFRI Crop Protection and Pest Management Program Grant no. 2015-70006-24281 for financial support.
North Carolina State Climate Office for development, implementation and hosting of the website.
Jeremy Greene (Clemson University), Alana Jacobson (Auburn University), Phillip Roberts (University of Georgia), and Dominic Reisig (North Carolina State University) for providing data and advice on the development of website.
Danny Pierce (Crop Management Services) and Will Connell (Ag Consultant, Inc.) and the Southeast Row Crop Entomology Working Group for providing advice on the development of the website.